Finding and Tuning Expensive Stored Procedures using Redgate Monitor
Redgate Monitor's Top procedures list makes it simple to find the procedures having the biggest impact on performance, allowing you to prioritize your tuning efforts, reduce risk and keep pace with the requirements of your growing database estate.
Stored procedures are a mechanism both for storing queries for reuse and for optimizing performance. We place commonly used logic into a single, reusable code unit with a defined interface. By parameterizing our queries in stored procedures, we allow the database engine to store and reuse compiled execution plans, which reduces the CPU load on the server and so lowers the cost of execution. The use of parameters also allows the database engine to create better plans, because it can use precise values, and therefore more accurate cardinality estimates, when generating each plan (known as parameter sniffing).
However, procedures are not a panacea for performance. You can still write poorly performing code within a procedure. Contention on resources occurs due to queries running from within stored procedures, the same as batch commands, and stored procedures are often called frequently and repeatedly. Further, parameter sniffing can cause problems when ‘atypical’ sniffed values generate poor plans.
For all these reasons, it’s a good idea to understand how your stored procedures are performing within SQL Server.
Monitoring Expensive Stored Procedures
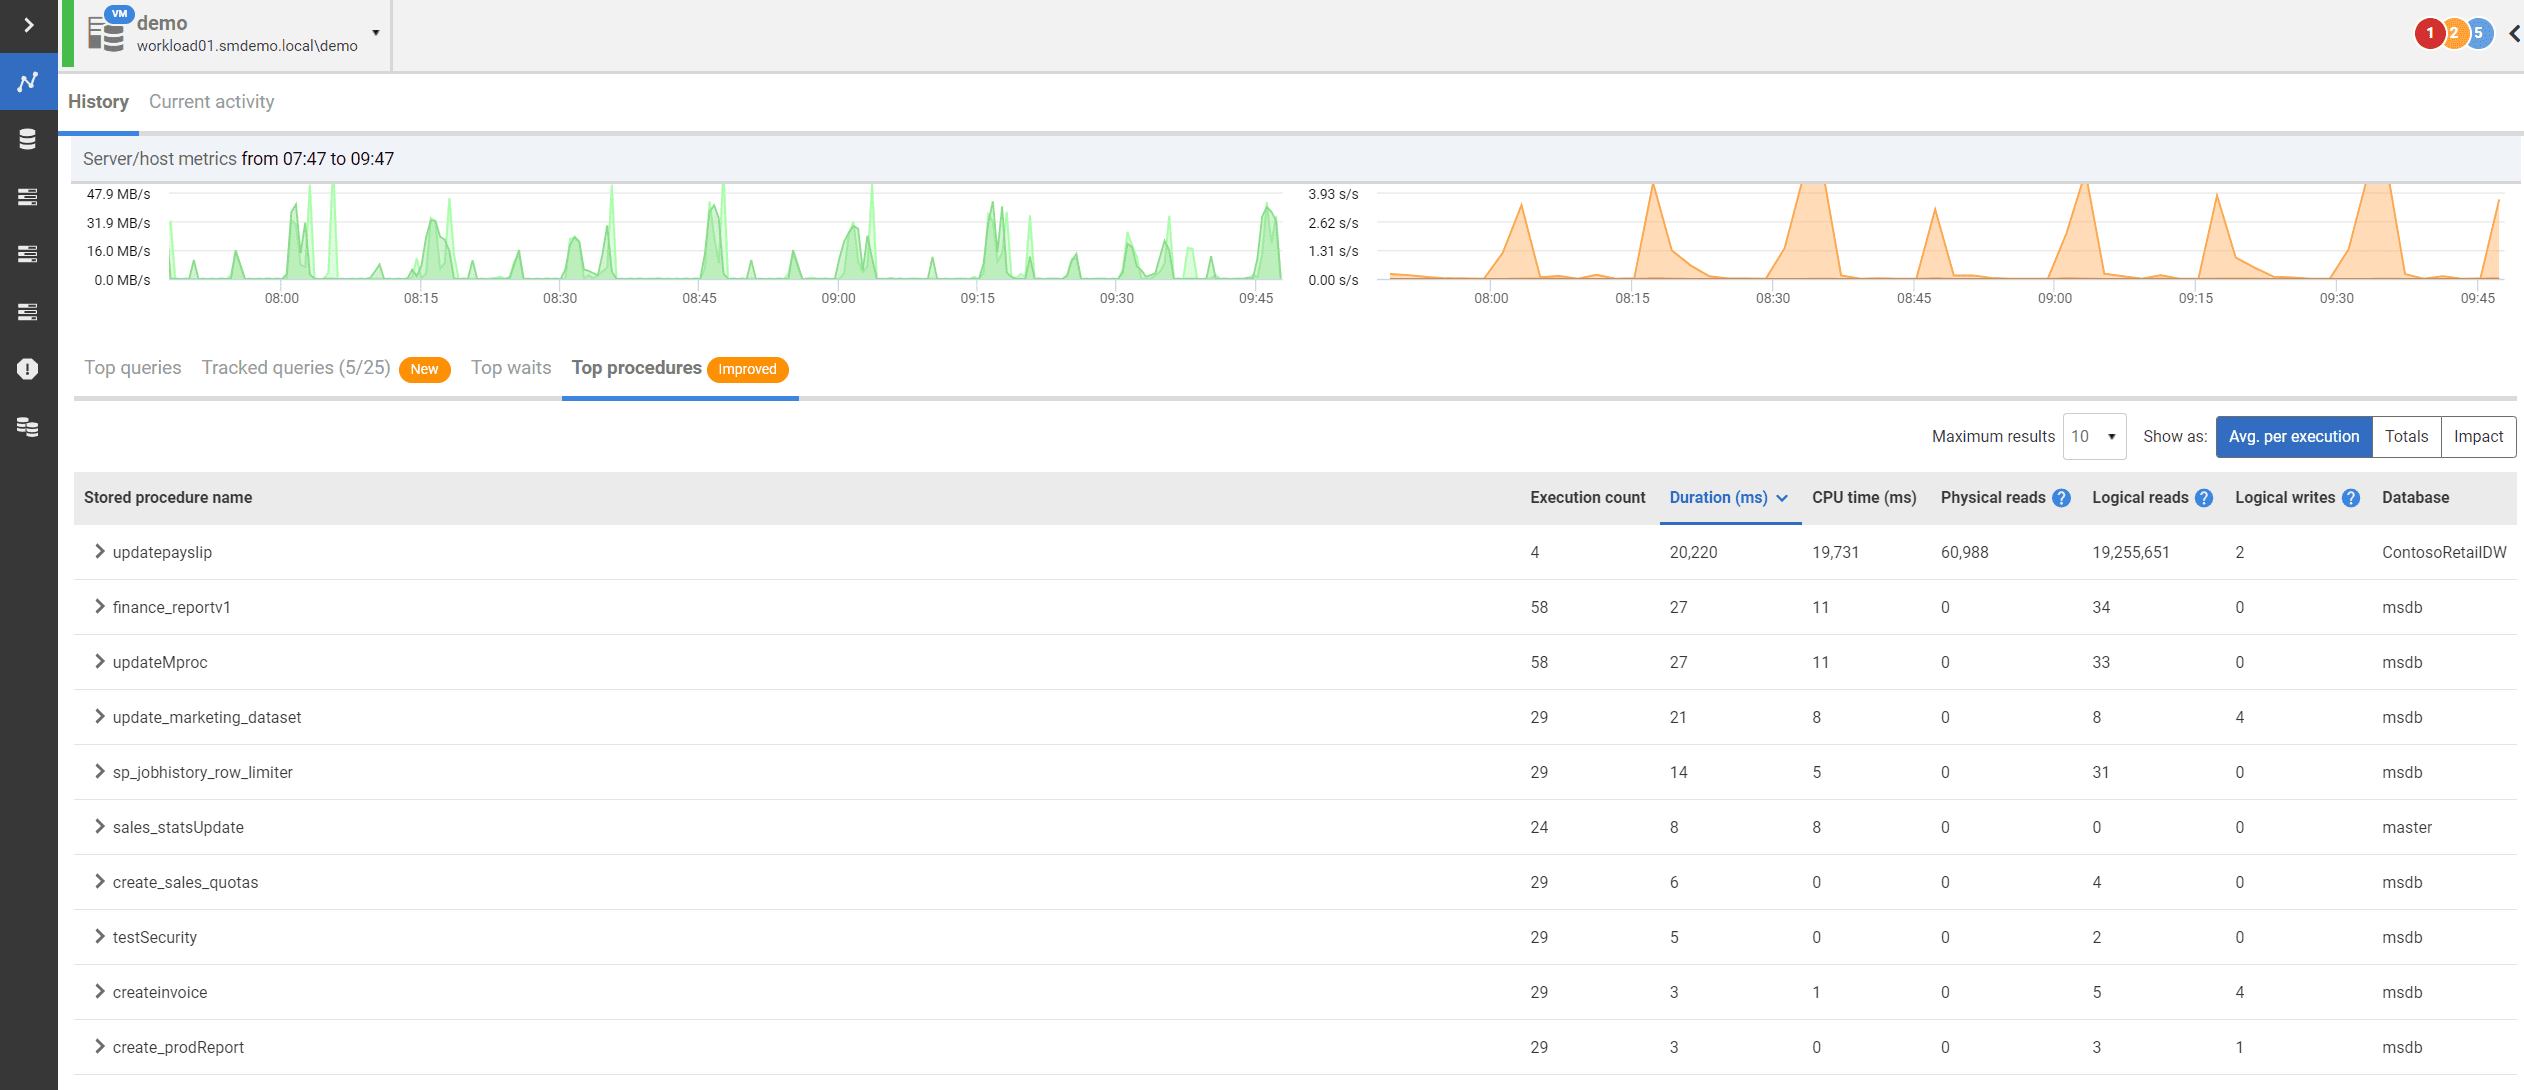
On the Server overview page in Redgate Monitor, just below the interactive timeline and server/host metric graphs, is a table that shows Top queries, Tracked queries, Top waits and Top procedures, recorded over the period indicated by the focus window on the interactive timeline.
Click on the Top procedures tab and you will see a list of the stored procedures that used the most resources over the selected period, based on data sampled from sys.dm_exec_procedure_stats. By default, the list is ordered by Duration (ms), but you can repopulate the list based on any of the other available query execution statistics, such as CPU time, Execution count and so on.

Which procedures have the biggest overall impact?
By default, the Top procedures list is populated based on average values per execution, over the period selected, but you can populate it based on totals, or on the estimated, overall impact of each procedure on the system’s resources.
When analyzing query performance no one metric tells the complete story, so the estimated impact of a stored procedure is based on a combination of CPU time, logical reads and logical writes. The calculation uses a logarithmic scale and produces a single number that we can use to assess and compare the relative impact of each procedure. This impact score will allow you to understand better where to focus your performance tuning efforts. If a new stored procedure is immediately appearing high in the list, you can tune it before it becomes too much of a burden on your server.
Drilling into the query details
If you expand one of the expensive stored procedures, you’ll find runtime statistics and query details for any queries in the stored procedure that also appear in the top queries tab over the same period. A procedure can have multiple queries, and this allows you to see quickly which of them have the biggest impact on system resources.

On expanding a query within the procedure, for example because it was the longest running, or consumed the most CPU, you get additional information about the query itself. This information includes the SQL Text, execution plan, a history of recompiles of the query over time, waits and memory allocation. All this information is used to help determine if there are issues with the query in question as part of your troubleshooting efforts.
For example, at monitor.red-gate.com, we have an example set of servers under observation using Redgate Monitor. One of the servers there simulates a system under load, workload02. If you follow the steps above, the top (worst performing) procedure based on the impact score is called ParameterSniffingFactOnlineSales. If you drill down to the details of the most expensive query in this procedure, following the steps above, you’ll see the following Query history chart (which uses data collected from Query Store):

You can see immediately that, following a recompile, performance degraded badly. You can click on the recompile events and see how the plan was changed. Based on this information, a fix to the situation can be quickly determined.
Whole Organization Benefits
This ability to monitor and understand the top procedures, and the queries contributing to them, brings benefits for all levels of an organization. For DBAs and developers, being able to get this information quickly for any server, without needing to seek it out, saves time and allows them to focus on tuning tasks that will have the biggest impact. This creates more room for value-added tasks to keep database teams motivated. As such, this feature fits nicely with the many other Redgate Monitor features that help your organization keep up with the demands of your growing data estate.
Tools in this post
Redgate Monitor
Real-time multi-platform performance monitoring, with alerts and diagnostics


