Integrating Redgate Monitor Alerts with New Relic
This article demonstrates how to use a script notification, in PowerShell, to automatically send database alerts raised by Redgate Monitor as incidents to New Relic. This simple integration makes it easy to feed the detailed diagnostics that only a specialized database monitoring system such as Redgate Monitor provides, and the DBA team relies on for a rapid response, into a single, organization-wide incident management system.
New Relic is an Application Performance Monitoring tool providing visibility across an organization’s applications and infrastructure. It naturally can’t be expected to offer the kind of information depth and richness which Database Administrators (DBAs) need from a dedicated database monitoring tool, but its breadth does make it a useful place to consolidate a view across the whole IT stack. For that reason, many DBA teams whose central IT organization uses New Relic wish to feed alert information from Redgate Monitor into that central place.
A good way to achieve that is to combine Monitor’s script notification mechanism, which runs a custom script such as PowerShell whenever an alert condition is raised, with New Relic’s Incident Event API, which can be used to tell that tool about problems detected by external systems.
Sending notifications from Redgate Monitor
Before setting anything up you’ll need to gather 3 pieces of information about your New Relic environment:
- The Account ID. This is a short number which can be found by logging into your New Relic account, clicking your profile picture in the bottom-left corner of the screen, navigating to the Administration page, choosing Plan & Usage, and noting down the account number in the Current Plan tab.
- An API Key. New Relic uses several different types of keys depending on context – for this integration, you’ll need an Ingest License Key. Again, click your profile picture in the bottom-left corner of the screen, but this time navigate to the API Keys page. From here, either copy an existing key, with type
INGEST–LICENSE, or create a new key for your account. - The New Relic endpoint address. This will depend on where your data is hosted but at the time of writing it was: insights-collector.eu01.nr-data.net, when using New Relic’s EU datacenter, or otherwise insights-collector.newrelic.com.
You must first enable the script notification functionality in Redgate Monitor, which is disabled by default as a security measure. That can be done by following these instructions, but briefly you must set the ScriptAlertResponse environment variable to 1 on the machines running Monitor’s Base Monitor and Web Server services, and then restart those services.
Next, in Monitor visit the Configuration page and select Notification Settings. Scroll down to Script Notifications, and tick to enable the functionality:

Any time an alert is raised in Monitor, the PowerShell script you enter here will be executed, which will send the alert notifications to the URL endpoint specified by New Relic, as an incident, with all the details of the alert included in an $AlertData object in the request payload.
A suggested script is provided here as a starting point. Copy it into the above Script Notifications box below #Your PowerShell code here, replacing the values for NrAccountId, NrApiKey, and NrApiEndpoint with the values you found earlier. At the bottom of the page, select Save Settings.
|
1 2 3 4 5 6 7 8 9 10 11 12 13 14 15 16 17 18 19 20 21 22 23 24 25 26 27 28 29 30 31 32 33 34 35 36 37 38 39 40 41 42 43 44 45 |
#These values could alternatively be retrieved from a vault $NrAccountId = "123456" $NrApiKey = "aB0cD1eF2gH3iJ4kL5mN6oP7qR8sT9uV0wX1yZ" $NrEndpoint = "insights-collector.newrelic.com" # For New Relic's US datacenter: insights-collector.newrelic.com # For New Relic's EU datacenter: insights-collector.eu01.nr-data.net # Much of the body data is common regardless of whether we're opening or closing an Incident # See https://docs.newrelic.com/docs/data-apis/ingest-apis/event-api/incident-event-rest-api # In particular aggregation tags must uniquely identify a Redgate Monitor alert - the combination # of Base Monitor Guid + Alert Id is sufficient, but we also include alert type / target. $BodyData = @{ eventType = "NrAiIncidentExternal" version = 1 source = "Redgate Monitor" entityName = "$($AlertData.Target.Name)" "aggregationTag.sqmTarget" = "$($AlertData.Target.Name)" "aggregationTag.sqmAlertType" = "$($AlertData.AlertName)" "aggregationTag.sqmBaseMonitorGuid" = "$($AlertData.BaseMonitorGuid)" "aggregationTag.sqmAlertId" = "$($AlertData.AlertId)" } if ($AlertData.AlertStatus -eq "Raised") { $BodyData.state = "trigger" $BodyData.title = "$($AlertData.AlertName) alert on $($AlertData.Target.Name)" $BodyData.description = "Redgate Monitor $($AlertData.AlertSeverity.ToLower()) $($AlertData.AlertName) alert was raised at $($AlertData.RaisedDateTime) on $($AlertData.Target.Name).`n`n$($AlertData.AlertDescription)`n`nDetails: $($AlertData.AlertUrl)" $BodyData.deepLinkUrl = "$($AlertData.AlertUrl)" $BodyData.priority = switch ($AlertData.AlertSeverity) { "High" { "critical" } "Medium" { "medium" } "Low" { "low" } } } elseif ($AlertData.AlertStatus -eq "Ended") { $BodyData.state = "resolve" } else { Exit } $Request = @{ Uri = "https://$NrEndpoint/v1/accounts/$NrAccountId/events" Method = "POST" ContentType = "application/json; charset=utf-8" Headers = @{"Api-Key" = $NrApiKey } Body = $BodyData | ConvertTo-Json -Depth 5 } Invoke-RestMethod @Request | Write-Host |
Viewing alerts in New Relic
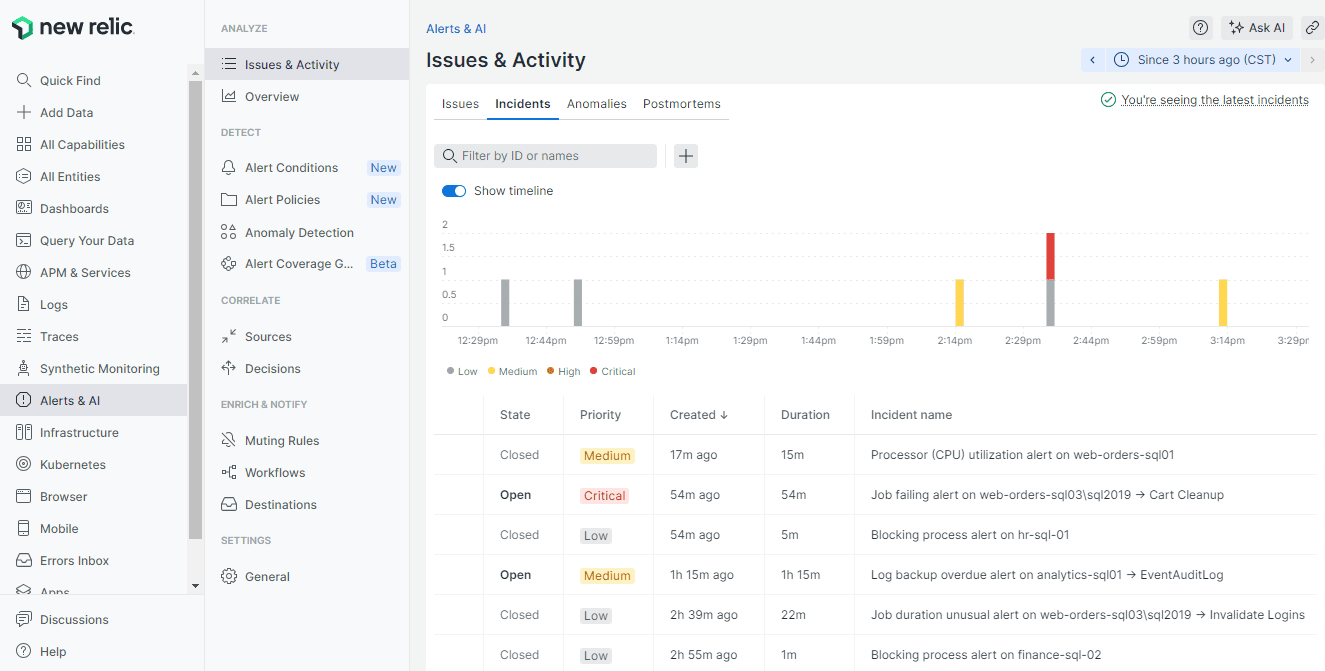
After logging into New Relic, go to the Alerts & AI tab, then navigate to Issues & Activity. Within this section, in the Incidents tab, you’ll see an Incident for each alert raised, complete with details of its severity (priority in New Relic’s terminology) and a description of the alert. Similar information is available in the Issues tab, with an Issue being created for each Incident, by default.

For alerts which Monitor can automatically end when the warning conditions cease to be true, the corresponding Incident and Issue in New Relic will also automatically be marked as closed. For example, Monitor can raise a backup overdue alert if a database hasn’t had a full backup for too long, but when a backup later successfully runs, Monitor will automatically then end the alert, so the Incident (and Issue) in New Relic will be closed too.
In the above view, of the 6 alerts sent to New Relic, 4 have been automatically closed (for example, the 2 blocking process alerts were automatically resolved when the query at the head of the blocking chain finished running and was no longer blocking other processes). The other 2 issues (a Job failing alert for a Cart Cleanup job and a Log backup overdue alert for the EventAuditLog database) are still unresolved, so remain open.
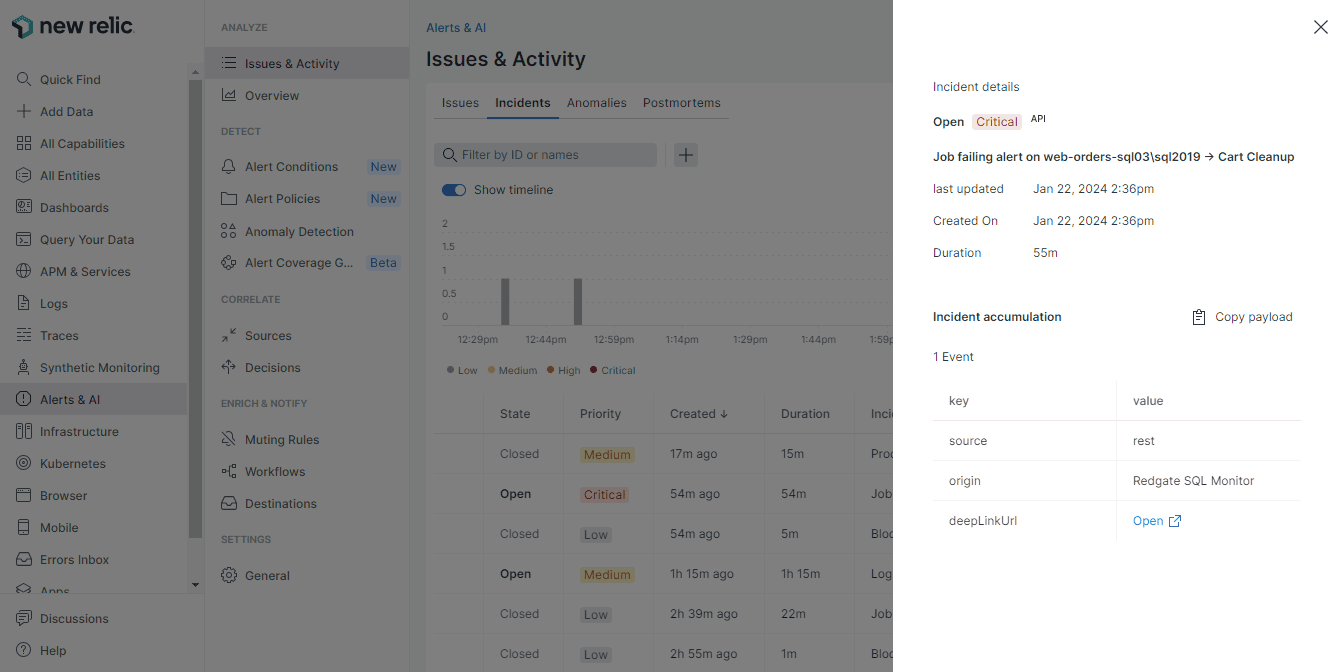
Perhaps most importantly, by selecting an Incident in New Relic, in the panel which subsequently appears you can select the deepLinkUrl to jump straight to the alert in Monitor, complete with all its rich context, which can help resolve the problem.

With Monitor’s alert data now available in New Relic, it’s also possible to use New Relic’s own logic to perform further actions such as sending additional alert notifications.
Customizing and testing your script notification
The script described above is provided only as an example; you may wish to adjust its behaviour to meet your specific needs. For example, you may consider a different mapping from Monitor’s alert severity into New Relic’s incident priority, to refine the message formatting, or even to add filtering so that certain alert types are conditionally ignored. You may alternatively prefer to use a different approach altogether, for example sending all alert data directly to New Relic as raw events via the Event Api and using custom logic within New Relic to create and manage Incidents based on NRQL (New Relic Query Language) criteria.
Testing any customizations from within Monitor may be time consuming because of the need to simulate alert conditions to test the response. Instead, you can save the script you intend to use (for example in a file called SqlMonitorToNewRelicNotifier.ps1) then use code like that shown below, from a separate file, to pass example alert data to your script. Note that it’s essential that you provide a unique AlertId each time data is sent into New Relic, so that number (01775 below) must be changed for each execution. When an alert is ended by Monitor, the script will be run a second time, with similar data provided but with the AlertStatus property set to Ended.
|
1 2 3 4 5 6 7 8 9 10 11 12 13 14 15 16 17 18 |
$AlertData = [PSCustomObject]@{ AlertId = 01775 AlertName = "Long running query" AlertDescription = "A query has run for longer than the acceptable duration" Target = [PSCustomObject]@{ Name = "test-sql01" GroupName = "Production" Tags = ("tag1", "tag2", "tag3") } AlertStatus = "Raised" AlertSeverity = "Medium" PreviousAlertSeverity = "None" RaisedDateTime = [datetime]::UtcNow EventDateTime = [datetime]::UtcNow AlertUrl = "https://monitor.url/alert/01775" BaseMonitorGuid = "01234567-89ab-cdef-fedc-ba9876543210" } & $PSScriptRoot/SqlMonitorToNewRelicNotifier.ps1 -AlertData $AlertData |
Summary
DBA teams tasked with managing an organization’s critical data require the deep-dive diagnostic and alerting capabilities which are only offered by dedicated database monitoring solutions like Redgate Monitor. But meanwhile there are certainly good reasons to want a broader, albeit shallower, view of the stack such as is offered by New Relic.
The above approach forms a great foundation for combining the best of both worlds, where teams can rely on Monitor’s richer visibility into databases, while consolidating a view of alerts up into New Relic as a single tool to unify incident management.
To discover more about how Redgate Monitor can help you know about any potential database issues, visit the solutions page, or try the online demo.
Tools in this post
Redgate Monitor
Real-time multi-platform performance monitoring, with alerts and diagnostics

