Monitoring Amazon RDS SQL Servers to Optimize Performance and Manage Costs
Israel Valverde explains the triple benefits of using Redgate Monitor to cover your SQL Server instances running on Amazon RDS, for SQL Server performance optimization, controlling AWS-hosting costs, and in providing a single, unified view of the health of all your SQL Servers, regardless of where they are hosted.
Amazon RDS provides managed SQL Server instances and can help customers to remove the burden of tasks like performing Operating System security updates and patching SQL Server. However, this does not remove the responsibility of ensuring your databases are healthy!
Redgate Monitor will collect all the metric and alert data you need to ensure your SQL Servers are reliable and perform efficiently, and that your team can identify issues and respond to any problems quickly. It will help you identity opportunities to make significant improvements to performance, meaning that you will also avoid unnecessary increases in your use of AWS storage and compute resources, and so will have better control over your ongoing operational costs.
If you are extending Redgate Monitor to your Amazon RDS instances, then you will also benefit from having a unified monitoring infrastructure for all your SQL Servers, and from being able to review the health and performance of all these instances through the same ‘pane of glass’, whether they are hosted on on-premise servers, Amazon EC2 machines, VMWare or in the Azure cloud.
What can I monitor?
For each Amazon RDS SQL Server instance that you add to Redgate Monitor, it will collect a built-in set of metrics and a configurable set of built-in alerts. It will collect metric and alert data both from your instances and databases and, if you provide AWS API credentials, from the AWS machines that host these instances.
Although Amazon RDS tries to make their SQL Server offering as close as possible to on-prem instances there are a few differences on the features that are available to customers. For example, RDS lacks support for Extended Events and a few DBCC statements. Because of such differences, we had to adapt some existing metrics from on-prem and even leave a few metrics behind, initially, as part of our incremental approach for adding support to RDS. You can find more about the available metrics (and alerts) for RDS in our documentation.
Nevertheless, Redgate Monitor can collect all the necessary metrics and alerts that you need to ensure your instances are healthy and you’ll find the experience of monitoring Amazon RDS instances very similar to traditional “on-premise” instance monitoring.
Instance- and database-level monitoring
For each Amazon RDS SQL Server instance Redgate Monitor retrieves scalar metrics that will allow you to assess, for example, SQL Server’s resource usage (CPU, memory), as well as levels of user activity (connections, requests) and the resulting SQL Server activity (locks, latches, scans). It will collect instance-wide metrics about any long running queries on your SQL Server databases, from Dynamic Management Views, as well as wait statistics to help you understand the primary causes of delays in processing user requests. Redgate Monitor v11 and later will also collect special diagnostic metrics for the tempdb database on each of your RDS instances, allowing you to track space usage by login, session and program, and making it much easier to diagnose the cause of any tempdb contention.
For each database on any of your monitored Amazon RDS instance, Redgate Monitor also collects a set of storage and performance metrics, such as shown on the following screenshot of the Server Overview page for an Amazon RDS instance.
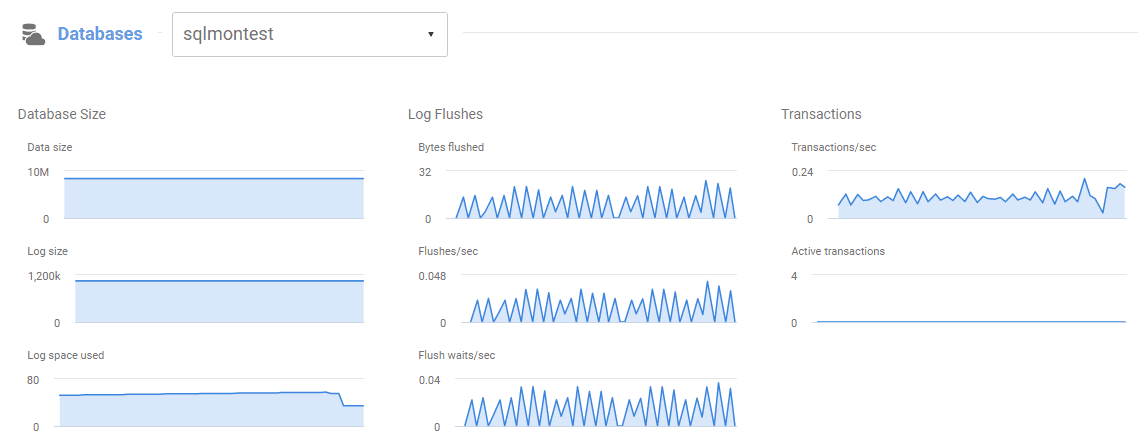
Figure 1 – Database-level metrics in the server overview page
Machine-level monitoring
Redgate Monitor will collect Amazon RDS machine metrics, providing measures of processor (CPU), memory and storage use, as well as IO metrics like IO throughput (read bytes per second and write bytes per second) and IOPS (reads per second and writes per second). All these metrics are retrieved from AWS CloudWatch, via the AWS API, and so you have to provide a set of credentials to allow Redgate Monitor to connect to the API, when adding your RDS instance in Redgate Monitor (check our documentation page for details of how to do this). Some of these machine metrics also require enhanced monitoring to be enabled for the Amazon RDS instance, which we recommend.
While Redgate Monitor can collect many useful machine metrics, the way we handle the concept of machines within Amazon RDS is a little different than for “on-prem” servers. Amazon AWS provides a managed environment, with only limited access to the machine hosting the SQL Server instance. For example, customers cannot arbitrarily start processes or add multiple SQL Server instances to the same machine. Therefore, Redgate Monitor does not have the concept of a “machine” when dealing with RDS instances. Instead, we associate machine-specific metrics and properties to the RDS instance itself, within Redgate Monitor’s internal data structures.
As a result, you’ll notice a difference when plotting these metrics on an analysis graph. For an on-prem instance, you’d select the metric and then specify the machine and the name of the instance:
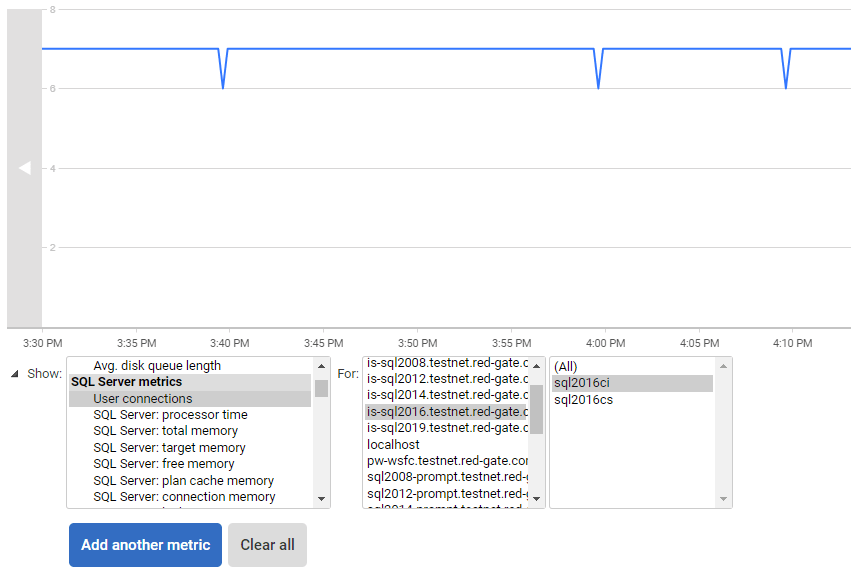
Figure 2 – Analysis graph for on-premise instance. Note that there are 2 levels of selection: one for the machine and another one for the instance.
By contrast, for Amazon RDS instances, you select only the metric and the Amazon RDS instance:
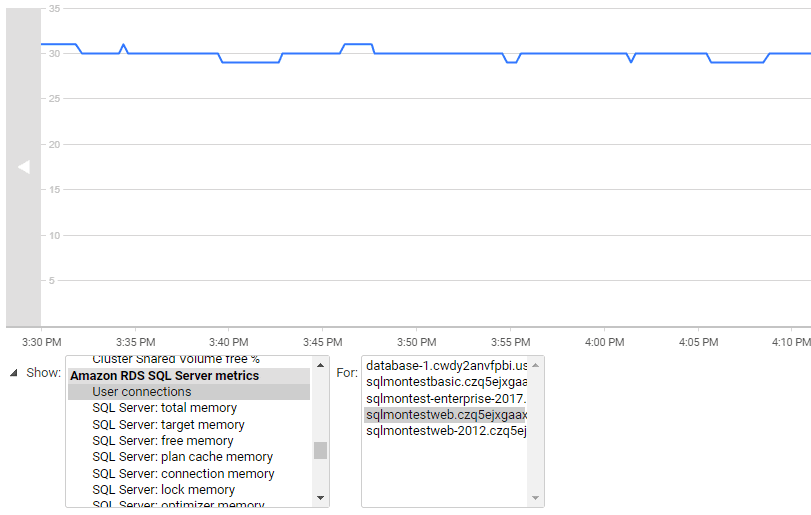
Figure 3 – Analysis graph for Amazon RDS instance. There is no input for specifying the machine.
How can I use this monitoring data?
The metric and alert data collected by Redgate Monitor will help you not only to improve the performance and reliability of your SQL Servers, but also help you avoid unnecessary hosting costs.
Optimizing Amazon RDS SQL Server Performance
While hosting your database on Amazon RDS instances will reduce the administrative burden, in terms of machine maintenance, you still have a responsibility to ensure that the users who access these databases always experience a good level of service.
Redgate Monitor plots and summarizes a range of machine, instance and database metrics on the Server Overview and Estate pages, just as for any on-premises instances. On the Server Overview page for an Amazon RDS instance, for example, you can correlate CPU, IO, Memory usage and Server waits, over a period, directly with details of the users and server processes that were running at the same time, any alerts that were raised, and full details of the queries that were executed. This data will allow you to diagnose and respond to problems, quickly, identify tuning opportunities, spot worrying trends in resource use, and plan any necessary expansion in resource requirements.
On the Analysis page, you can examine patterns of behavior in a set of Amazon RDS metrics, and to compare current values to their ‘baselines’ to see how metrics values vary over different time periods, and so spot anomalies. As Jamie Wallis discussed in his article, Monitoring Amazon RDS SQL Servers with Redgate Monitor v11, you’ll want to track certain critical metrics, such as IOPS for read operations, carefully to ensure optimum performance.
Keeping your AWS hosting budget under control
When we talk about AWS, we usually must talk about costs. Migrating your infrastructure to the cloud is likely to reduce your costs, because with Amazon RDS you don’t have to pay that lump sum to acquire hardware or SQL Server licenses. All that might seem like a great deal at the start, but you then have to be on top of your running costs.
For example, if performance of one of your Amazon-hosted instances deteriorates, it would be easy just to upgrade to a more powerful instance type, but this will also, of course, increase your operational costs. By using Redgate Monitor, any need to increase your use of Amazon AWS resources, and therefore costs, will be expected and planned, rather than reactive, and you’ll understand much better how and where strategic tuning efforts will best help you maintain good performance without needing to increasing hosting costs.
Tracking CPU use on Burstable instances
For Amazon RDS instances, you need to make sure you choose the right instance sizes for your workload. The instance size determines not only the memory and processor power but also network capabilities of your instances. There is one type of instance called a burstable instance, which is intended for workloads that need a sudden burst of CPU but that, for most of the time, will not have a significant CPU usage.
These instances have very attractive pricing compared to the non-burstable ones and they work on the basis that you accumulate or ‘spend’ CPU credits relative to a CPU ‘baseline’. For example, the CPU baseline for your T2 instance type might be 30% vCPU utilization. If the CPU usage is under this baseline, it will accumulate CPU credits. Those credits can then be consumed when the instance needs a burst in CPU usage that goes above the baseline. This is often appealing for low priority RDS instances with low to moderate workloads Monday-Friday during business hours (eating through CPU credits during the day then recharging overnight).
In normal circumstances, if one of those burstable instances need to use more CPU than its baseline and if there are no CPU credits available, the CPU usage will be throttled to the baseline usage. The T3 instance though has the unlimited mode enabled, which means that it will use the necessary CPU even if there is no CPU credit available. In that case, the vCPU usage that exceed the baseline will add an extra charge to your bill.
At the time of writing (November 2020), RDS applies a flat charge of 0.05 USD per vCPU hour beyond the baseline. This might look like a small price to pay, but we can see a small example of how this would work out:
t3.small instance type (2 vCPU and 20% baseline CPU usage)
– US East (N. Virginia) region: 0.044 USD per hour
– RDS instance running 24 hours per day at 80% CPU for 30 days.
Fixed price within baseline:
0.044 USD per hour*24 hours*30 days=31.68 USD per month
Extra price for CPU burst:
0.05 USD per vCPU hour*(80% usage-20% baseline usage)*2 vCPUs=0.06 USD per hour
0.06 USD per hour*24 hours*30 days=43.2 USD per month
Total compute cost:
31.68+43.2=74.88 USD per month
The extra “CPU burst” charges more than double the monthly compute costs! For the same money, you could simply upgrade to a better instance type.
Therefore, it’s important to understand how the burstable instances work and keep an eye on your CPU usage. With Redgate Monitor you can configure alerts for your instances that are raised whenever CPU usage on the RDS instance exceeds a threshold value. You could create a server group in Redgate Monitor, for each of your different Amazon RDS instance sizes and customize a processor utilization alert for each group. This will ensure costs do not get out of hand and leave you with a nasty surprise at the end of the month.
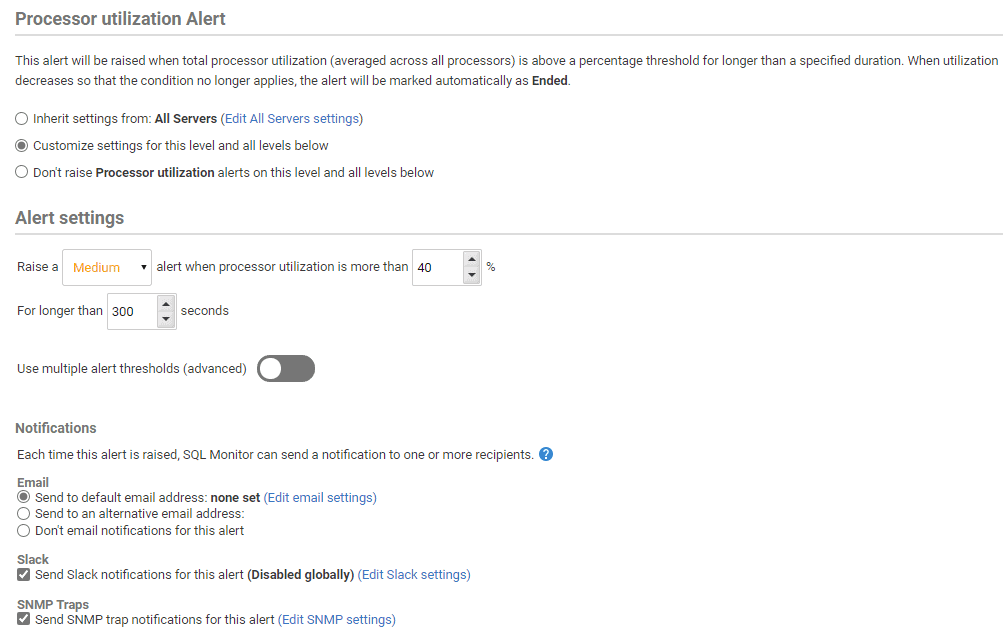
Figure 4 – Configuring Processor utilization alert in Redgate Monitor
Reserved instances
Another thing you should consider when moving to Amazon RDS is if you could benefit from their Reserved Instances offering. This option can offer more than 60% discount in your Amazon RDS compute costs and is recommended for database applications that have a steady state of usages levels and is expected to remain like that for, at least, the next 12 months. Although the option that offers the highest savings is for a 3-year commitment paid upfront there’s a one year option with no upfront payment that can still give you about 30% off over the standard on-demand pricing.
Redgate Monitor makes it easier to detect patterns in usage for your instance, assisting you to identify instances that could benefit of the Reserved instances. You can use the baseline option, present in the analysis and the server overview pages, to compare metrics usage over a period. This would bring confidence that a given instance has a predictable steady usage and could be moved an RDS reserved instance.
To learn more about RDS reserved instances options, check the AWS documentation page.
Minimizing Monitoring Costs
Redgate Monitor will help you manage and optimize your Amazon AWS “compute costs” and can be configured to help you ensure that monitoring your Amazon RDS databases is as efficient as possible, and doesn’t incur significant extra charges to your AWS bills.
There are a couple of ways you can do this.
Data transfer
Possibly the biggest ‘hidden cost’ in the Amazon world is the data-transfer charges as it’s often neglected when assessing the costs of moving to the cloud, perhaps because it’s not something sold as a particular service. Like most of the other Amazon services, RDS only charges for data transferred out of your instances, and the amount charged changes based on where the data is being sent to.
Transferring data from your Amazon RDS to the internet can be more than 4 times more expensive than transferring it to another Amazon RDS. This means that if you have your databases hosted in Amazon RDS then you should also host any components of your architecture that are consuming data form those databases within AWS, ideally in the same Availability Zone. This will help minimize the data transfer costs.
That is no different for Redgate Monitor. Since it will be pulling metrics from your RDS SQL Server instances, and machine metrics from AWS CloudWatch (via the AWS API), it’s recommended to host your Base Monitor within the same availability region.
To learn more about data transfer charges in Amazon RDS, check Amazon RDS pricing page.
Enhanced Monitoring and Logs storage
Metrics and logs are part of the CloudWatch service in AWS and Redgate Monitor might use them to retrieve machine metrics, as discussed earlier, to provide a better view of what’s going on with your RDS instances. We recommend, if possible, that users enable Enhanced Monitoring, which means that RDS will start to push real-time machine metrics to CloudWatch, to allow us to get a more complete view of the state of the machine running the RDS instance.
However, of course, ingesting and storing these real-time metrics comes at an extra cost. Even though there’s a generous free tier for that service, with 5GB of ingested data and another 5GB of stored data per month, users who are monitoring many instances can go over that quota.
There are two ways to minimize any additional costs. Firstly, we recommend that you reduce the frequency with which Enhanced Monitoring metrics will be pushed CloudWatch to once per minute, which matches the frequency at which Redgate Monitor will sample this data:
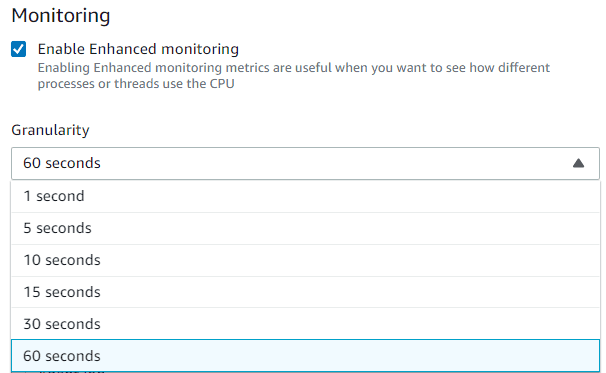
Figure 5- Enhanced Monitoring option and its granularity when configuring your Amazon RDS instance.
If you want more detailed information for a few instances you could use more frequent collections, but keep in mind that changing setting a granularity of 1 second, for example, will generate 60 times more logs than collecting it every minute, so configure it wisely.
Secondly, you can reduce the storage costs of your logs by reducing the retention period in CloudWatch. When the Enhanced Monitoring feature is enabled it will generate a CloudWatch log group named RDSOSMetrics, and this is where your RDS machine metrics will be stored. By default, the retention period will be of 30 days, which can add up to a lot of storage, depending on how many instances you have and which granularity you’re using for retrieving data. Since Redgate Monitor will be retrieving those logs every minute you can significantly reduce the retention to a few days, or even just one day if you don’t have any other use for these logs.
Monitor your Amazon RDS SQL Server instances like never before!
I hope this article could be of any help to people that are new to Amazon RDS or are considering using it for their estate.
With the addition of Amazon RDS monitoring to Redgate Monitor, you can now monitor all your SQL Server instances, wherever and however they are hosted, within the same tool and using the same monitoring infrastructure. You will have a single, uniform view into activity and resource use on all of your SQL Servers, regardless of whether that are hosted on traditional on-premise Windows servers, Amazon EC2, Amazon RDS, Azure IaaS, Azure SQL Server Databases or on VMWare.
If you have ever experienced the difficulties of having to swap between different portals to review a different set of monitoring data for each of these different parts of your database system, becoming entangled by different terminologies and services along the way, you’ll appreciate how much time this will save you.
If you want to give it test drive, you can start monitoring your RDS instances today with our free trial, check it out!
Tools in this post
Redgate Monitor
Real-time multi-platform performance monitoring, with alerts and diagnostics
