Security and compliance
Ensure data security and compliance with data masking, monitoring, and change traceability
By Roger Hart and Carlos Quintero, October 30th, 2012
Carlos Quintero (MVP, and developer of MZ-Tools) recently wrote a blog post on debugging into Visual Studio's assemblies. We liked it, and asked him to tell us a bit more…
As a developer of Visual Studio add-ins, I have been using .NET Reflector to understand the internals of Visual Studio assemblies since many years ago, and I consider it an invaluable tool for developers of Visual Studio extensions (add-ins, packages, etc.). In this guest post I will explain why.
Developing a somewhat complex Visual Studio extension, there are two scenarios where you may desire to have the Visual Studio source code and even to debug its assemblies:
Microsoft has released the source code of the .NET Framework and you can even debug its assemblies, but it hasn't done the same with Visual Studio assemblies. This is where. NET Reflector comes to the rescue. You can use .NET Reflector for those two scenarios. I'll illustrate this with a real case...
The first scenario is to decompile Visual Studio assemblies. Although Visual Studio was born as a native C++ application, with each release more and more of its code became managed (.NET). Visual Studio assemblies are stored in the GAC 2.0 (C:\Windows\assembly), GAC 4.0 (C:\Windows\Microsoft.NET\assembly) and in the Common7\IDE folder (and the PrivateAssemblies and PublicAssemblies sub-folders).
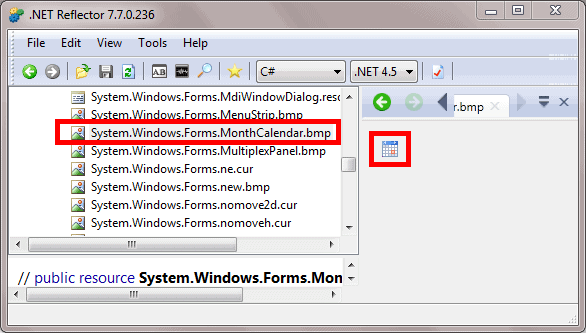
My MZ-Tools 7.0 add-in for Visual Studio provides a Control Explorer feature that is basically an enhanced version of the Document Outline built-in feature of Visual Studio. While adapting my add-in to the Dark / Light themes introduced by Visual Studio 2012 I wondered how the Document Outline got the gray bitmaps of components of System.Windows.Forms 4.0.0.0, for example the MonthCalendar:

If you decompile that assembly with .NET Reflector you will see that the bitmaps are the colored ones of previous versions:

I knew that in a previous beta the bitmaps of the System.Windows.Forms 4.0.0.0 were gray. But that of course broke the Document Outline feature of Visual Studio 2010, showing the bitmaps of Visual Studio 2012 (gray) rather than the colored ones.
In Visual Studio 2012 RTM Microsoft fixed that problem using some approach, but which one? To discover which, I decompiled the Visual Studio assembly that contains the Document Outline feature. This happens to be Microsoft.VisualStudio.Windows.Forms.dll (in the folder C:\Windows\Microsoft.NET\assembly\GAC_MSIL\). By the way, this is the only thing that .NET Reflector can't do for you: to guess which Visual Studio assembly contains some feature.
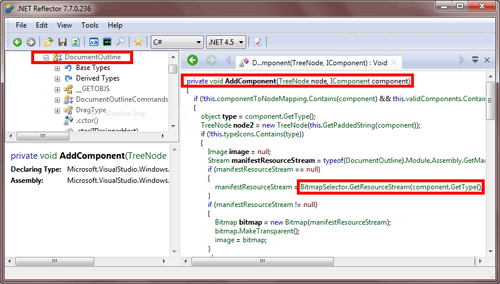
Once you have loaded the version of the assembly that belongs to Visual Studio 2012 in .NET Reflector (v4.0_11.0.0.0__b03f5f7f11d50a3a sub-folder), if you search for “DocumentOutline“, you get the type that contains the feature, which has an AddComponent method with the hint to solve the problem:

So, there is a BitmapSelector that, if you load the version of the assembly that belongs to Visual Studio 2010 (v4.0_10.0.0.0__b03f5f7f11d50a3a sub-folder), didn't exist. How the BitmapSelector gets the correct bitmap is beyond the scope of this post, but if you are interested you can read my article HOW TO: Get the bitmap of a component type from Visual Studio add-in.
The second scenario is to debug Visual Studio assemblies. For years, I have used .NET Reflector only to decompile assemblies. Recently I was thrilled to discover that I could debug them too and I wish I had discovered it much earlier.
Continuing with the first scenario, suppose that you want to debug that AddComponent method to learn how Visual Studio gets the correct bitmap. This is how you would proceed:
Microsoft.VisualStudio.Windows.Forms.dll assembly and right-click the "Enable Debugging" context menu. Click the "Done" button when the decompilation is complete.Microsoft.VisualStudio.Windows.Forms.dll node and go to the "Microsoft.VisualStudio.Windows.Forms" namespace, DocumentOutline class, AddComponent method and double-click it to open its source code. Put a breakpoint on that method.These are two scenarios where .NET Reflector can save you a lot of time integrating your extensions within Visual Studio – because extensibility is tricky, and Visual Studio's own features already do many things that you need to do with your own. So it's worthwile to learn how Microsoft does it.
Carlos Quintero is a Microsoft Most Valuable Professional (MVP) in the Visual Developer / Visual Basic categories since 2004. He is the author of MZ-Tools (www.mztools.com), a family of popular add-ins for Visual Studio, VB6, VB5 and VBA. He loves Visual Studio extensibility and shares his knowledge in his blog, articles and answering questions in the MSDN Visual Studio Extensibility (VSX) forum.