
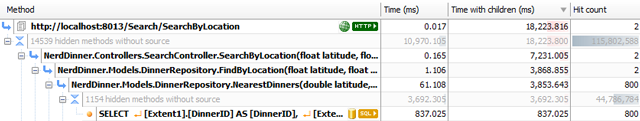
In May last year, the ANTS Performance Profiler team added the ability to profile database requests your application makes to SQL Server or Oracle. The really cool thing is that you’re shown those requests in the application’s call tree, so you can see what .NET code caused those queries to run. It’s particularly helpful if you’re using an ORM which automagically generates and runs queries for you, but which doesn’t necessarily do it in the most efficient way possible.
Now by popular demand, we’ve added support for profiling MySQL (or MariaDB) and PostgreSQL, so you can see queries run against those databases too.
Some of you have also said that you’re using the Devart dotConnect data providers instead of the native .NET ones, so we’ve added support for those drivers too. Hope it helps!
For the record, here’s a list of supported connectors (ones in bold are new):
SQL Server
- .NET Framework Data Provider
- Devart dotConnect for SQL Server
Oracle
- .NET Framework Data Provider
- Oracle Data Provider for .NET
- Oracle Fully Managed Data Provider for .NET (added in v9.2, released 17 July 2015)
- Devart dotConnect for Oracle
MySQL / MariaDB
- MySQL Connector/Net
- Devart dotConnect for MySQL
PostgreSQL
- Npgsql .NET Data Provider for PostgreSQL
- Devart dotConnect for PostgreSQL
SQL Server Compact Edition
- .NET Framework Data Provider for SQL Server Compact Edition
- Devart dotConnect for SQL Server Pro
Have we missed a connector or database which you’d find useful? Tell us about it in the comments or by emailing dotnetteam@red-gate.com.
Ben
Load comments