

A few weeks ago, I delivered some sessions about vector search in Fabric Databases and Azure SQL. Let’s talk about some advanced features available in both of them.
Before analysing these advanced features, we need to understand some concepts about vectors and embeddings.
Embeddings Concepts
Creating embeddings is the process of creating vectors for documents or images, representing the content of these elements.
Each vector dimension has a specific meaning. The precise meaning is not easy identifiable, it depends a lot of the model used to create the embedding. Let’s consider that identifying the meaning of each dimension is not something usual.
There are two properties of the vector which are important to us: Magnitude and Direction
Embeddings Magnitude
Magnitude means the strength of the vector. In relation to embeddings, this means how informative and important the document is in relation to the subject of the document. It can also mean the confidence the model has in this fact.
A small magnitude may mean the text is generic, ambiguous or lack strong features (in simple terms, lack strong information. In practice it’s more complex, of course).
A large magnitude suggests the text has rich, specific or highly informative content, resulting in strong features.
For example:
- Doc A: “Cats are great pets.”
- Doc B: “Cats and dogs are wonderful pets, and they bring joy to families.”
Document A and B have the same subject, in this way they have the same direction. However, document B is more detailed, so it contains a larger magnitude.
Embeddings Direction

The embedding direction points to the subject of the source text used to create the embedding. Considering two documents, if the embeddings point to the same direction, this means they have the same subject. Different directions mean different subjects.
Let’s say you have two text documents:
- Document A: “The climate is changing rapidly due to greenhouse gases.”
- Document B: “Global warming impacts weather patterns worldwide.”
When embedded:
- Both vectors will have directions representing the concept of climate change because the model learns to represent similar topics or meanings with similar vector orientations.
Now consider:
- Document C: “The stock market experienced a sharp decline today.”
The vector for Document C will point in a completely different direction because its semantic meaning (finance and stocks) is unrelated to climate change.
Vector Distance Calculation
Considering we have Magnitude and Direction. This brings different methods to calculate the vector distance.
Using Magnitude and Direction: The vector distance can be calculated using both factors, magnitude and direction. A search in this format will consider the strength and subject of the document.
Direction only: This calculation method considers only the subject of the document, not the magnitude. This option considers that small documents can still provide answers.
In order to use the Direction only method, a special calculation needs to be made to equalize the magnitude of the vectors. This is called Vector Normalization. If we choose a Direction only distance calculation method, the normalization will be done automatically for us.
The Direction only calculation method is more usual to avoid biased results. Large documents can generate large magnitudes even when their content is very repetitive. In this way, direction only calculation is more usual, but you can decide to focus on magnitude as well, changing the calculation method.
Let’s jump to practice: The Vector_Distance function
The first parameter of the Vector_Distance function is the calculation method for the vector distance. There are 3 methods available:
Cosine: This method considers only direction, not magnitude. Before the distance calculation, the vectors are normalized. This process equalizes the magnitude, resulting in only the direction being used in the distance calculation.
Euclidean: This method is better for images than text documents.
Dot: Also called Dot Product, this method considers both magnitude and direction for the distance calculation.
Another Function: Vector_Norm
It’s important to understand that Norm and Normalization are two different processes in relation to the vectors. Normalization is the equalization of the vector magnitude. Norm is the calculation of the vector magnitude.
It’s very common to calculate the vector_distance directly using a cosine calculation method. However, we can make the norm calculation ourselves and use the result of filter the distance calculation and results of the vector search.
The Vector_Norm function uses 3 different Norm calculation methods:
Norm1: This is also called Mahattan Norm. This one is efficient to highlight the difference of sparse vectors from the other ones. Sparse vectors are the ones which have a high occurrence of zero or near zero values. This means documents which have very low content about a lot of features, maybe because they are focused on specific ones.
Norm2: This one is called Euclidean Norm. Balances all features but highlight the dominant ones. This is the most used.
Norminf: This one highlight the most important feature of each vector, although we can’t clearly identify what exactly this feature means semantically.
Sample Usage
Considering the table walmart_product_details, the same used in my presentations, let’s calculate the maximum and minimum Norm of the vectors
Max(Vector_norm(product_description_vector, ‘norm2’)),
Avg(Vector_norm(product_description_vector, ‘norm2’))
FROM walmart_product_details
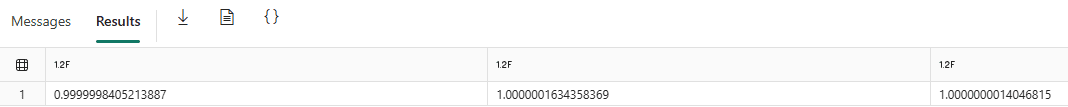
The average norm is above 1, but there are norms below 1.
FROM walmart_product_details
WHERE Vector_norm(product_description_vector, ‘norm2’) < 1

From 30,000 products, almost half have below average norm
We can use the norm in the search for the information we need. We can filter the records by the norm values, checking only the ones above average to focus on the result.
This is an example of the search for a product according to the norm:
‘help me plan a high school graduation party’
DECLARE @search_vector VECTOR(1536);
DECLARE @retval INTEXEC @retval = dbo.Get_embedding
‘textembedding’,
@search_text,
@search_vector output;
SELECT TOP(10) id,
[product name],
description,
Vector_distance(‘cosine’, @search_vector,
product_description_vector) AS
distance
FROM [dbo].[walmart_product_details]
WHERE Vector_norm(product_description_vector, ‘norm2’) > 1
ORDER BY distance
The filter by the Norm is the difference in this execution. Let’s compare the result filtered by the norm and without the filter.
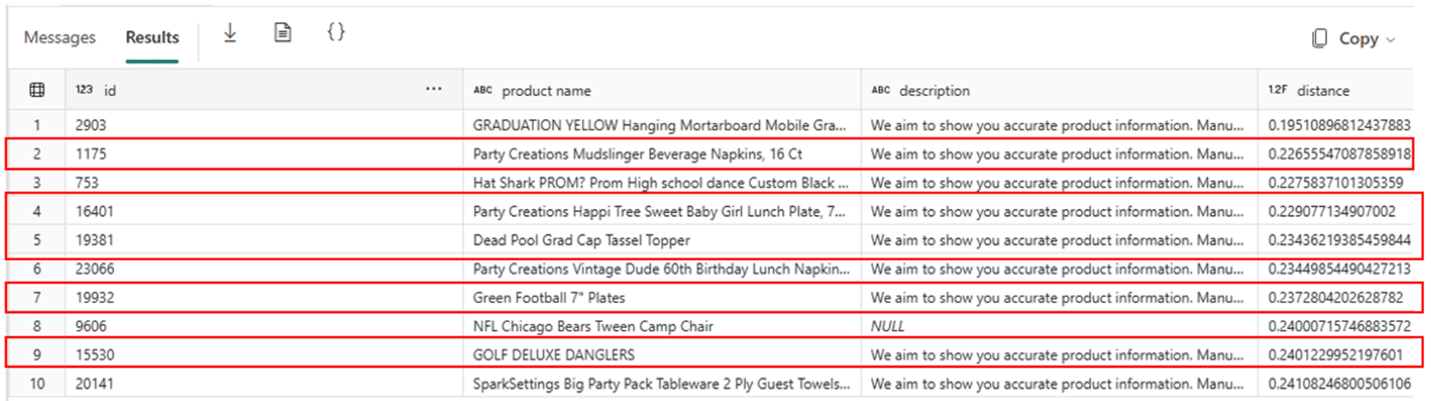
This first result below is without the filter by norm. The rows marked in RED are the ones which appear without the norm filter, but doesn’t appear with the norm filter
This is the result with the norm filter. Once again, the results in RED are the ones which apper with the norm filter, but doesn’t appear without the norm filter:
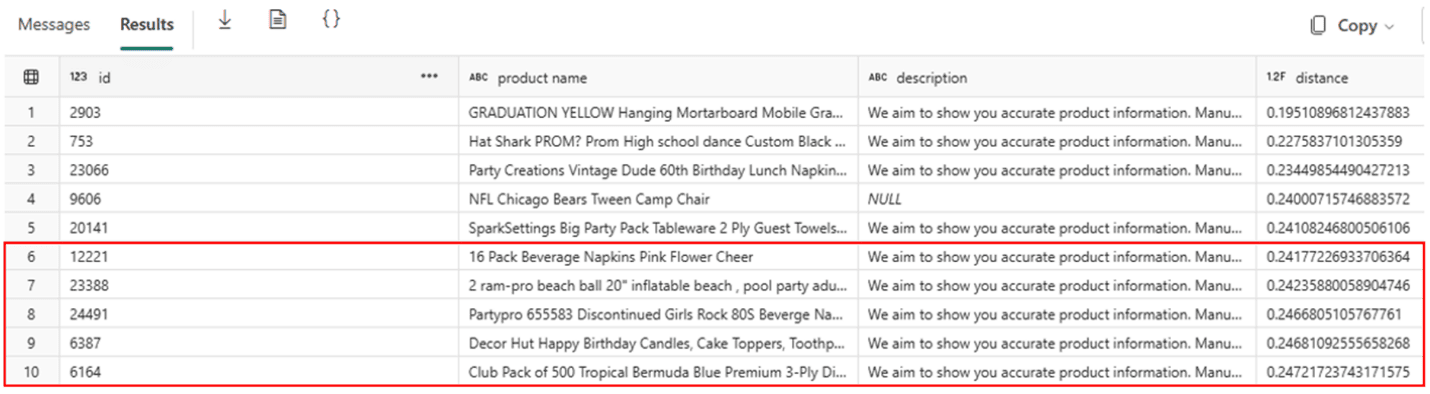
The norm filter makes the result very different. Is it better? Is it worse? I would love to hear your opinion.
References
Vector_Distance function: https://learn.microsoft.com/en-us/sql/t-sql/functions/vector-distance-transact-sql?view=azuresqldb-current
Vector_Norm function: https://learn.microsoft.com/en-us/sql/t-sql/functions/vector-norm-transact-sql?view=azuresqldb-current
Summary
I’m a data specialist, but not a mathematician. Considering the new features in Fabric Database and Azure SQL, I’m trying to put it in practical ways. Would you add something to the explanation? I would love to hear the comments.


Load comments