
Fabric Capacity consumption is exposed to us through a Power BI app called Fabric Capacity Metrics.
We need to install this app on our environment and keep it updated.
However, analyzing the information on the app has its own challenges.
Some common questions are:
- Why the drill through to a point in time show activities which took place way before that point in time?
- Why when you start a new scheduled workload, such as a notebook or pipeline, the consumption starts an increasing pattern during some days, instead of only increase during the scheduled execution?
- When you remove a scheduled workload, such as a notebook or pipeline, the consumption doesn’t go immediately down, taking some days to decrease?
All these questions have one single answer: Smoothing
What’s Smoothing
Smoothing is the feature which allows the capacity to break down a momentaneous execution along hours or days.
According to my observation, there is a default of 24 hours, but I’m not sure if it applies to all scenarios.
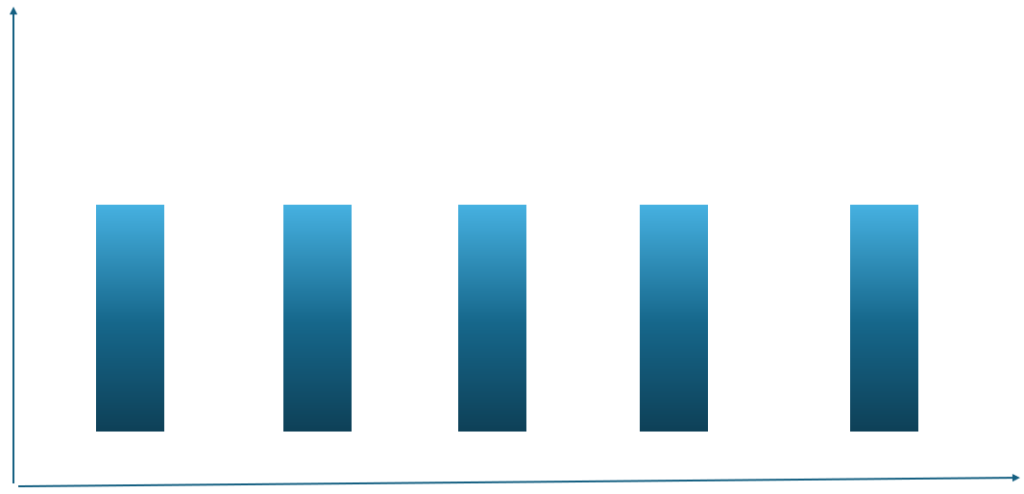
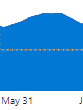
Let’s consider a notebook scheduled to run every 2 hours. The capacity consumption should look like this:

However, smoothing changes this pattern, we will not see this kind of consumption. Every execution of the notebook is broken down during a period of 24 hours.
The real amount of consumption we will see can be represented like this:

Of course, no visual is precise like this in relation to smoothing, but understanding smoothing allows us to understand our questions about the Fabric Capacity Metrics report and some best practices in relation to consumption.
Why does the drill through to a point in time in the capacity show activities which took place way before that point in time?
The drill through to a point in time by default shows the start and end of the activity. However, it’s very common to see in the result many activities with a start and end date with no relation to the point in time we are analyzing.
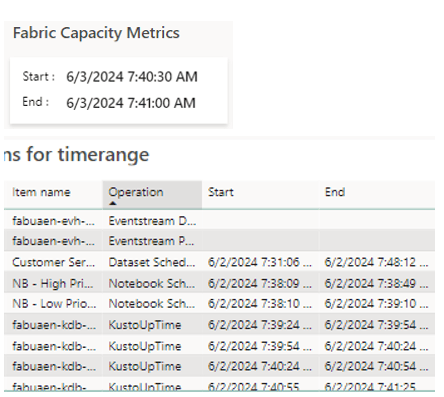
The activities are displayed in the report because their costs are spread along up to a day or more and the smoothing duration is overlapping with the point in time you asked.
In this way, that activity is displayed in the drill through. You can check this by adding to more fields to the table. These fields are not present by default.
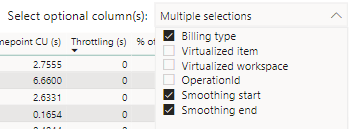
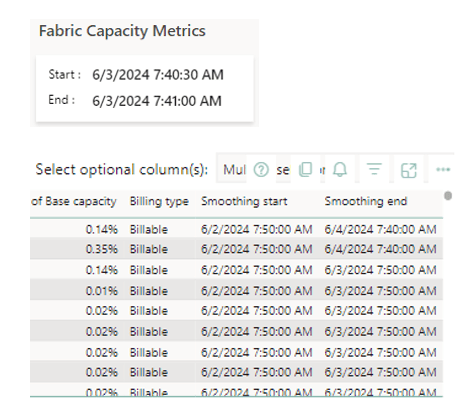
The Smoothing start and End overlaps with the point in time. Most of them are 24 hours, but some of them are 48 hours
Why when you start a new scheduled workload, such as a notebook or pipeline, the capacity consumption starts an increasing pattern during some days, instead of only increasing during the scheduled execution?
Once again, smoothing.
Each execution of a scheduled workload will accumulate over and over again during a period of at least 24 hours. During this period, your capacity will show an increasing consumption pattern.
The increasing pattern will continue until the first executions reach their “smoothing end date” and disappear from the consumption. At this point, consumption stabilizes.
It may not seem so, but this increasing pattern in the visual has more than 24 hours in it
This creates some guidance for good practices:
- When enabling a new scheduled workload, don’t assume immediately the capacity supported it because the first execution worked. You need to follow the increasing pattern for 24 hours or more to ensure it’s supported by the capacity.
- If you need more precision, you can check the consumption of one execution and multiple by the number of executions which will accumulate over a 24-hour period. In this way, you can have a better idea if the capacity will support the increase or not
When you remove a scheduled workload, such as a notebook or pipeline, the capacity consumption doesn’t go immediately down, taking some days to decrease?
One more time: Smoothing.
Once you stop a scheduled execution, you will still have 24 hours of previous executions being charged from the capacity. In this way, you will not see the result immediately.

This reduction in the visual took more than 24 hours to happen
Once again, this brings some best practices to follow:
- Never wait the last moment to remove some consumption from the capacity. Your consumption will take 24 hours to reduce, the last moment may be too late.
- If your increasing pattern is getting close to 100% and not stopping, remove the schedule immediately. Each execution accumulates 24 hours of charges. These charges will not disappear when you stop the scheduling.
The benefits of Smoothing
The purpose of smoothing is exactly to avoid situations such as the first chart.
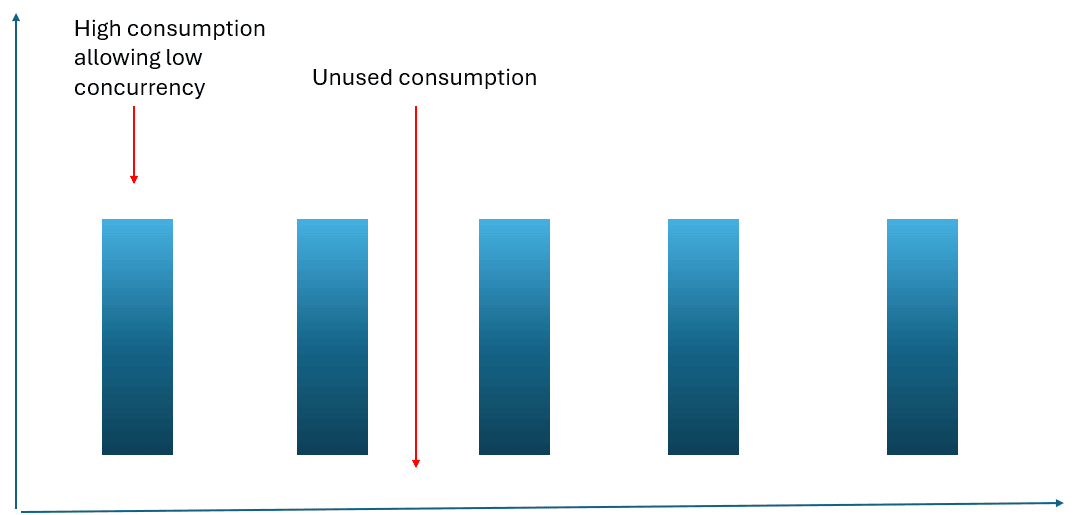
The smoothing avoids this, spreading the cost along times where the consumption would be low and allowing a higher concurrent consumption


Load comments