Today I’m excited to share a big new release of ANTS Performance Profiler to help you with the all-too-common problem of slow SQL Server queries causing performance issues for your .NET application. The video below walks through the new functionality, or you can skip ahead to read more.
For some time, ANTS has shown you information about database queries, and even how the code you wrote is responsible for them running. This has been useful for identifying slow queries or overly-chatty applications making too many database requests, which is particularly common when misusing ORMs. Unfortunately until now, once a slow query was identified it could still be difficult to understand why it was slow.
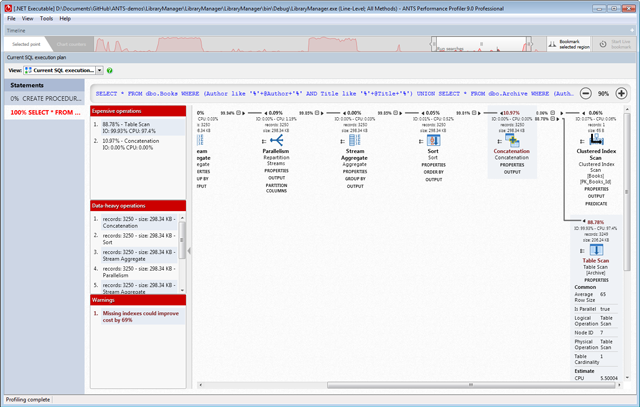
The new version changes that. Having identified a slow query or stored procedure run against SQL Server, you can now view its execution plan, right inside ANTS, in a single click.
Expensive and data-heavy operations are picked out for you, making navigation easy, and you can see detailed information about any operations. You’ll also see various warnings, for example about missing indexes (along with the script to create those indexes if you choose).

We also now provide a lot more information about SQL Server queries.
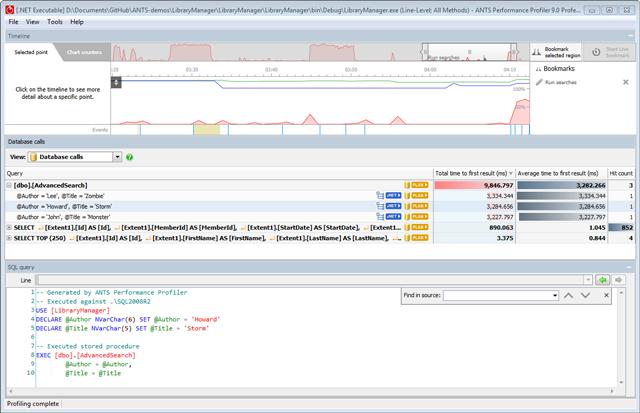
Instead of aggregating data by the statement text or name of a stored procedure, you can drill down to see data for each individual run of the query. This information matters because sometimes it’s critical to know that a query which ran twice taking a total of 10 seconds didn’t take 5 seconds each run, but rather took 100ms the first time and 9.9s the second time.
For each run of the query we now capture additional information, including the values of any parameters (which can have a significant impact on execution time), and the name of the server and database. This information is essential for rerunning queries, so we present the information in a way you can copy and paste directly into SSMS and run without any reformatting. This should make it easier to debug a query outside of ANTS, or even to request help from a team member or DBA.

You can try the new version for yourself by downloading a free trial. We hope you find the new capabilities helpful – as usual we’d love to hear your feedback!
Ben


Load comments