
Note: Please be kind on my PowerShell programming techniques. If I am doing something really horrible, let me know. I will change my code.
As our team struggles to get to a place where we can do continuous integration, some of the biggest issues we have needed to work on is figuring out how to build out our various jobs to run maintenance tasks and SSIS packages. While building a system in PowerShell to take a set of JSON files and outputting a set of jobs and dependencies, I really wanted to find a way to visualize what turns out to be a directed graph structure. My goal is to work through that entire process in blogs, taking the job generation system I built for our corporate use and improve it, and publish the code. My goal is to fix where I made a lot of really mediocre choices in places due to not having a clue what I was doing, and still not exactly being all that great at PowerShell. The basic concepts of what to do to create an agent job (or in my case, 30 or so, agent jobs, and their dependencies on each other,) is not terribly difficult, but it is definitely different working in PowerShell, as there is not a lot of documentation out there (and seemingly less so for the Visio parts!)
For this first step, I am going to use 3 JSON files. With the structure represented in these snippets:
JOBS_Definition.Json
|
1 2 3 4 5 6 7 |
{ "Jobs": [ { "SystemName": "SalesProcessing", "SubsystemName": "_MasterSalesProcessing", "EnvironmentName": "GeneralOperation" }, |
JOBS_Dependency.Json
|
1 2 3 4 5 6 7 8 9 10 11 |
{ "JobDependency": [ { "SystemName": "SalesProcessing", "SubsystemName": "_MasterSalesProcessing", "EnvironmentName": "GeneralOperation", "DependsOnSystemName": "OrderProcessing", "DependsOnSubsystemName": "_MasterOrderProcessing", "DependsOnEnvironmentName": "GeneralOperation", "DependencyNotes" : "Added because orders and sales running together were crushing bandwidth" }, |
JOBS_Schedules.Json
|
1 2 3 4 5 6 7 8 9 10 |
{ "JobSchedule": [ { "SystemName": "OrderProcessing", "SubsystemName": "_MasterOrderProcessing", "EnvironmentName": "GeneralOperation", "JobStartHour" : 12, "JobStartMinute" : 0, "DaysOfWeek" : "MON,TUE,WED,THU,FRI,SAT,SUN" } |
The gist of the setup is: Jobs are defined in the definition file. Initially they can be T-SQL, SSIS type jobs. System and Subsystem reference SSIS constructs of Folder and Package (and I define Project to be equal to Folder, which I may change later. But for simplicity’s sake, we keep them the same. There is a database used to hold the schedule hierarchy later, and it will be used to query to see what jobs to kick off later in the path. The files are incomplete at this point, but I will grow them to cover all of the things I am adding to the tool.
The files for this code are located in github here: https://github.com/drsqlgithub/SSISDeployTool/tree/3437402cc1e79db79ccceb83af05d9607ec864bb
All of this is going to be really hard to put into a blog, but when I am done, the entire code will be in a github repository, committed blog by blog (plus others, naturally, as I work through each step and mess things up over and over like a good programmer!), so you can go back and get the code where I was in the process.
The following is the code used. The basics are:
- You need to have Visio installed.
- The code instantiates Visio, then draws a box for every node, and a line for every Dependency
- Schedules are used for discovering jobs that are “scheduled” to highlighted as root nodes, and not “triggered”
The code is commented so I won’t go over it in any detail, but will answer any questions (and alter the code in the future if I learn better habits.
|
1 2 3 4 5 6 7 8 9 10 11 12 13 14 15 16 17 18 19 20 21 22 23 24 25 26 27 28 29 30 31 32 33 34 35 36 37 38 39 40 41 42 43 44 45 46 47 48 49 50 51 52 53 54 55 56 57 58 59 60 61 62 63 64 65 66 67 68 69 70 71 72 73 74 75 76 77 78 79 80 81 82 83 84 85 86 87 88 89 90 91 92 93 94 95 96 97 98 99 100 101 102 103 104 105 106 107 108 109 110 111 112 113 |
function SSIS_DrawHierarchInVisio ($P_DefinitionJsonFile,$P_DependencyJsonFile,$P_SchedulesJsonFile) { #Required: # 1. Install Visio to your machine # 2. In Powershell run: install-module visio as administrator #Minimal File Formats for this function: #$P_DefinitionItems Jobs:(SystemName, SubsystemName, EnvironmentName) #$P_DependencyItems JobDependency:(SystemName, SubsystemName, EnvironmentName, #DependsOnSystemName, DependsOnSubsystemName, DependsOnEnvironmentName) #$P_ScheduleItems JobSchedule:(SystemName, SubsystemName, EnvironmentName) TRY { if ($G_VerboseDetail){ Write-Host "SSIS_DrawHierarchInVisio $P_DefinitionJsonFile,$P_DependencyJsonFile,$P_SchedulesJsonFile" } #Opens Visio you should see the window open New-VisioApplication #Adds a document to the Visio window $VisioDoc = New-VisioDocument #now the shapes are added to the window $viShapes=Open-VisioDocument -Filename $G_VisioTempate #Set shape we will use for the job $ParentItem = $viShapes.Masters.Item("ParentNode") $ChildItem = $viShapes.Masters.Item("ChildNode") $connector = $viShapes.Masters.item("RightDirectedConnection") #Set context to a page for later use $Page = $VisioDoc.Pages[1] #Open the JSON files $DependencyItems = Get-Content $P_DependencyJsonFile | ConvertFrom-Json $DefinitionItems = Get-Content $P_DefinitionJsonFile | ConvertFrom-Json $ScheduleItems = Get-Content $P_SchedulesJsonFile | ConvertFrom-Json #Loop through the nodes items, and create a node on the diagram if ($G_VerboseDetail){ Write-Host "Creating Nodes" } $itemsI = $DefinitionItems.Jobs.Count for ($i = 0; $i -lt $itemsI ; $i++) { #fetch the three name parts (if your folder and project names differ, you can easily add that) $L1_SystemName = $DefinitionItems.Jobs[$i].SystemName $L1_SubsystemName = $DefinitionItems.Jobs[$i].SubsystemName $L1_EnvironmentName = $DefinitionItems.Jobs[$i].EnvironmentName #give the shape a name. The text may differ $ShapeName = "$L1_SystemName-$L1_SubsystemName-$L1_EnvironmentName" $ShapeText = "$L1_SystemName $L1_SubsystemName $L1_EnvironmentName" #This subloop tells me if the item has a schedule. A scheduled node is a root node to the directed graph #so I make it look different $ItemsJ = $ScheduleItems.JobSchedule.Count $DrawingItem = $ChildItem #default to it being a child node for ($j = 0; $j -lt $itemsJ ; $j++) { $L11_SystemName = $ScheduleItems.JobSchedule[$j].SystemName $L11_SubsystemName = $ScheduleItems.JobSchedule[$j].SubsystemName $L11_EnvironmentName = $ScheduleItems.JobSchedule[$j].EnvironmentName IF ($L11_SystemName -eq $L1_SystemName -And $L11_SubSystemName -eq $L1_SubSystemName -And $L11_EnvironmentName -eq $L1_EnvironmentName ){ $DrawingItem = $ParentItem #Make the node look like a parent node if a row matched; break; #can stop because it is already a parent } else { } } #drop the item on the canvas anywhere, we will redraw $Shape = $Page.drop($DrawingItem,1.0,1.0) #set the text and name of the shape $Shape.Text = "$ShapeText" $Shape.Name = "$ShapeName" } if ($G_VerboseDetail){ Write-Host "Creating Edges" } #dependencies are predecessors in the chain $itemsI = $DependencyItems.JobDependency.Count for ($i = 0; $i -lt $itemsI ; $i++) { #this is the child node $L2_SystemName = $DependencyItems.JobDependency[$i].SystemName $L2_SubsystemName = $DependencyItems.JobDependency[$i].SubsystemName $L2_EnvironmentName = $DependencyItems.JobDependency[$i].EnvironmentName #this is the node that must finish first in the calling hierarchy $L2_DependsOnSystemName = $DependencyItems.JobDependency[$i].DependsOnSystemName $L2_DependsOnSubsystemName = $DependencyItems.JobDependency[$i].DependsOnSubsystemName $L2_DependsOnEnvironmentName = $DependencyItems.JobDependency[$i].DependsOnEnvironmentName #Format the names of the shapes for referencing $ShapeName = "$L2_SystemName-$L2_SubsystemName-$L2_EnvironmentName" $DependsOnShapeName = "$L2_DependsOnSystemName-$L2_DependsOnSubsystemName-$L2_DependsOnEnvironmentName" #add a connector from the DependsOnShapeName to the Shape $Page.Shapes["$DependsOnShapeName"].AutoConnect($Page.Shapes["$ShapeName"], 0, $Connector) } #Layout the diagram as a flowchart. A good starting point, but even in this example not enough $LayoutStyle = New-Object VisioAutomation.Models.LayoutStyles.FlowchartLayoutStyle #Apply the format, and I made it Landscape for wider models Format-VisioPage -LayoutStyle $LayoutStyle -Orientation "Landscape" if ($G_VerboseDetail){ Write-Host "Diagram completed and created in a Seperate Window, Not Saved." } } catch { Write-Error $_ Write-Host "Something is incorrect in the JOBS_BuildBaseFile" } } |
This code is in the LIBRARY_Functions.ps1 file, the file where all of the functions needed to implement this process will be found. The final process includes a way to copy the files from the code store, to make a “point in time” “executable” piece of code for deployment.
There are two other files involved in the Visio generation process, one called LIBRARY_Locations. This file currently only contains:
|
1 2 3 4 |
$BaseDirectory = Get-Location #This script should be portable, so I added the path #dynamically $Global:G_VisioTempate = "$BaseDirectory\VisioShapes\SSISDeployShapes.vssx" |
But it may later include compilers, etc. I made it code instead of Json to allow the use of variables (and in some cases, an environment, like if a common path is different on my home and work computers, or your computer. It is for code that is used on all of the programs in this library.
Finally, the file TOOL_DiagramHierarchy.ps1 includes the functions and locations, then sets the files for the process. Defines a variable to decide how chatty the application is, and then calls the SSIS_DrawHierarchyInVisio function:
|
1 2 3 4 5 6 7 8 9 10 11 12 13 14 15 16 17 18 |
#get the function scripts . $BaseDirectory\LibraryFiles\LIBRARY_Locations.ps1 . $BaseDirectory\LibraryFiles\LIBRARY_Functions.ps1 #display lots of Write-Host messages to help the user see progress $global:G_VerboseDetail = $True; #get the json documents that you will work with $DefinitionItemFile = "$BaseDirectory\JOBS_Definition.json" #defines the jobs we have $DependencyItemFile = "$BaseDirectory\JOBS_Dependencies.json" #defines the dependencies between jobs $ScheduleItemFile = "$BaseDirectory\JOBS_Schedules.json" #defines the schedules to run jobs #In a future change, I will add a validation step to the process to make sure things #are configured as desired (no self dependencies, duplicate jobs, etc) #Draw the diagram if ($VerboseDetail){Write-Host "Starting SSIS_DrawHierarchInVisio"}; SSIS_DrawHierarchyInVisio $DefinitionItemFile $DependencyItemFile $ScheduleItemFile |
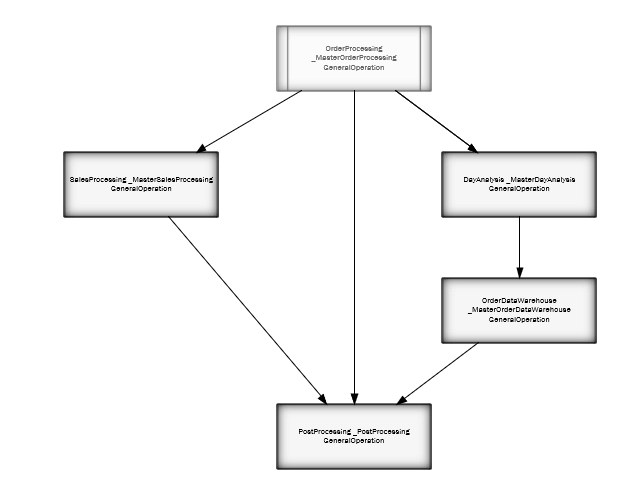
Just run this file, using the supplied Json files, and you will (hopefully) see something like this:
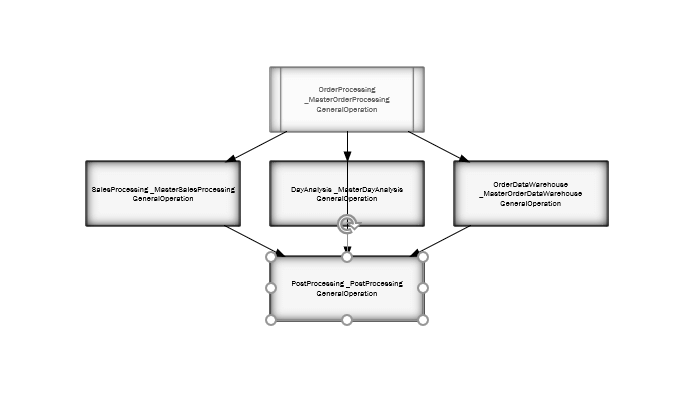
With only 5 boxes on the diagram, it already chose to have a line overlapping an entity. No formatting type I could find in Visio or the UI did a decent job. On my diagram with 30 items, it was a bit of work to reorganize the items. It was not however, as hard as making the diagram by hand.
The reason I started with this technique was because it is a lot more exciting than many of the other tasks in the job system, and is universally valuable if you have a graph to diagram. Instead of Json, you can easily use tables (or a graph structure) and extrapolate how to do this (Well, assuming you are better at PowerShell than I am so far!)


Load comments