Range queries are a very common task in SQL: selecting dates, numbers, or even text values that fall within some specified range. For instance: all loan applications for the month of March, or all sales transactions between $50 and $500. SQL developers are generally adept at writing such queries and indexing them to ensure they perform well.
But when the requirements are changed slightly — to compare two ranges of values to find where they overlap — it’s suddenly a whole new ballgame. These so-called “overlap queries” are trickier than they appear.
Overlap Queries
The most common overlap queries involve temporal (date and time) ranges, known as intervals. For example, imagine a query for patients at a hospital. If you wish to find all patients initially admitted during the month of August, that’s a simple range query. But if you wish to find all patients whose duration of stay — another date interval — lies at least partially in the interval of August, that’s an overlap query. While writing such queries isn’t hard, writing them to perform well can be difficult. Let’s see why.
A Use Case Scenario
Let’s examine an actual problem involving an overlap query. The database for a large museum tracks the time all visiting patrons enter and leave the building. It also maintains the times of all outages in its video security system. After a rash of minor thefts, the head of security has asked for a list of all patrons who were present during one or more security outages. Clearly, we have one datetime range, the length of a patron’s stay, which must be compared with another, the interval denoting a security outage. The goal is to find all overlapping instances.
The Database.
A table of patrons contains an initial and final timestamp indicating the duration of the visit and an id indicating the associated patron. And an outages table similarly defines the start and end timestamps of each outage. For simplicity, we include no other columns.
|
1 2 3 4 5 6 7 8 9 10 |
CREATE TABLE patrons ( patron_id INT generated always as identity NOT NULL, enter Timestamp(0) NOT NULL, leave Timestamp(0) NOT NULL ); CREATE TABLE outages ( location_id INT generated always as identity NOT NULL, start_time Timestamp(0) NOT NULL, end_time Timestamp(0) NOT NULL ); |
To test performance on a large dataset, we’ll populate both tables with 20 years of random data. (The script to fill the tables is in the Appendix section that follows the Conclusion section at the end of the article.)
In SQL, the canonical way to compare intervals is with the OVERLAPS() operator. To find all cases of overlap, simply form the dates from each table into intervals, then compare with this operator:
|
1 2 3 4 |
SELECT * FROM patrons p CROSS JOIN outages o WHERE (p.enter,p.leave) OVERLAPS (o.start_time, o.end_time); |
This query works — it retrieves the appropriate rows, at least — but it’s extremely slow. (On my test system (Windows 11 with PostgreSQL 16, test machine is an AMD 5700x CPU, 2GB SSD, Windows 11), it takes 3+ minutes). A first attempt to optimize the query might lead you to create a composite index on outage start and end time, and a similar one on patrons:
|
1 2 |
CREATE INDEX ON outages USING BTREE(start_time, end_time); CREATE INDEX ON patrons USING BTREE(enter, leave); |
No help: the query is just as slow A little research finds that the OVERLAPS operator doesn’t support indexes. So instead, we specify the comparisons explicitly.
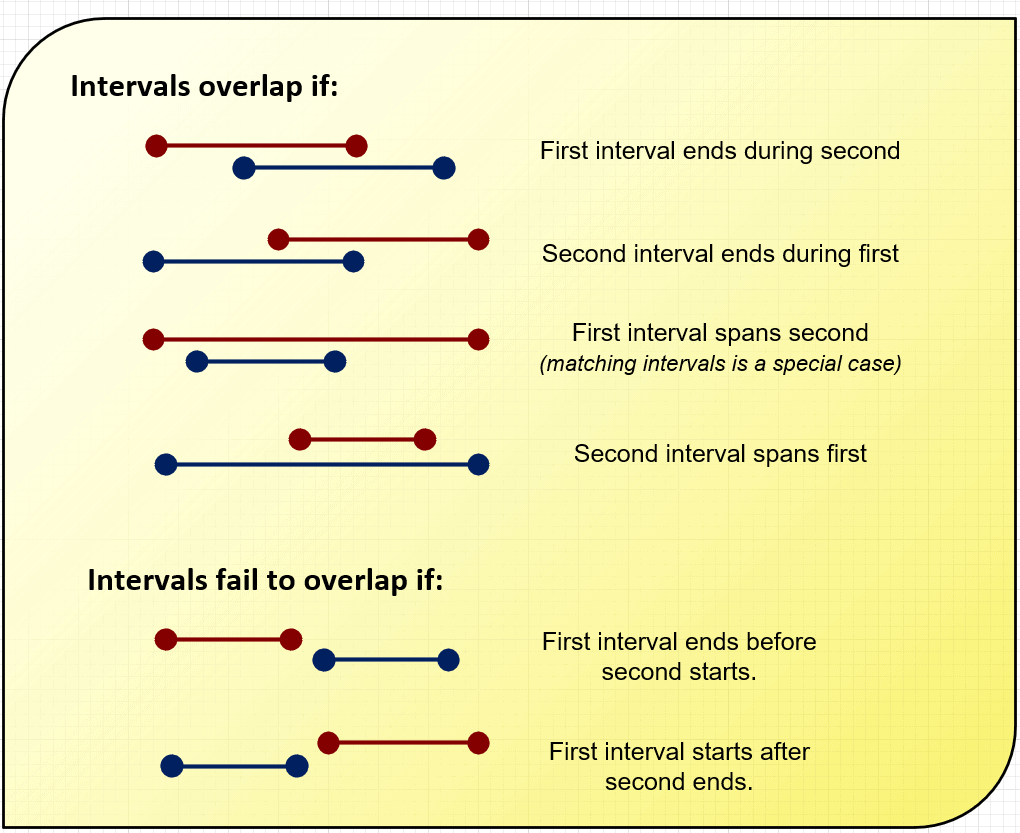
The first time you attempt a query like this, you’ll likely draw lines on a sheet of paper and see there are four different ways two intervals can overlap (see graphic.) This makes a rather complex query, but we can simplify it with a little trick. There are only two ways that intervals don’t overlap. If we write the non-overlapping query, then invert with a NOT, we get the desired result.

For example, a WHERE clause to find all non-overlapping cases for interval1 and interval2 looks like this:
|
1 2 |
WHERE interval1.start > interval2.end OR interval2.start > interval1.end |
If we invert the entire query with NOT, we find all cases of overlap
|
1 2 |
WHERE NOT (date1.start > date2.end OR date2.start > date1.end) |
This simplifies (using Boolean logic rules) to:
|
1 2 |
WHERE date1.start <= date2.end AND date2.start <= date1.end) |
(Note: The query is written to conform to the SQL standard on temporal intervals, which states that overlap occurs if one interval starts exactly when the other ends. This means that values that overlap by exactly 0.00 seconds are included. If you wish to require a minimum amount of overlap, adjust your queries accordingly)
So, what did we accomplish? Well, the explicit form is somewhat faster (26.1 secs), but an actual production table can be orders of magnitude larger than these samples.. We’d expect a query like this to be lightning-quick. Examining the access plan, we see PostgreSQL combining a table scan with an index scan — no indexed lookups are being used.
In a final bout of desperation, you might break the composite indexes each into two separate indexes: one for each timestamp. This not only doesn’t help, but (if you removed the original index) it will be just as slow as the original OVERLAPS() form. What’s wrong?
The Trouble With B-Trees
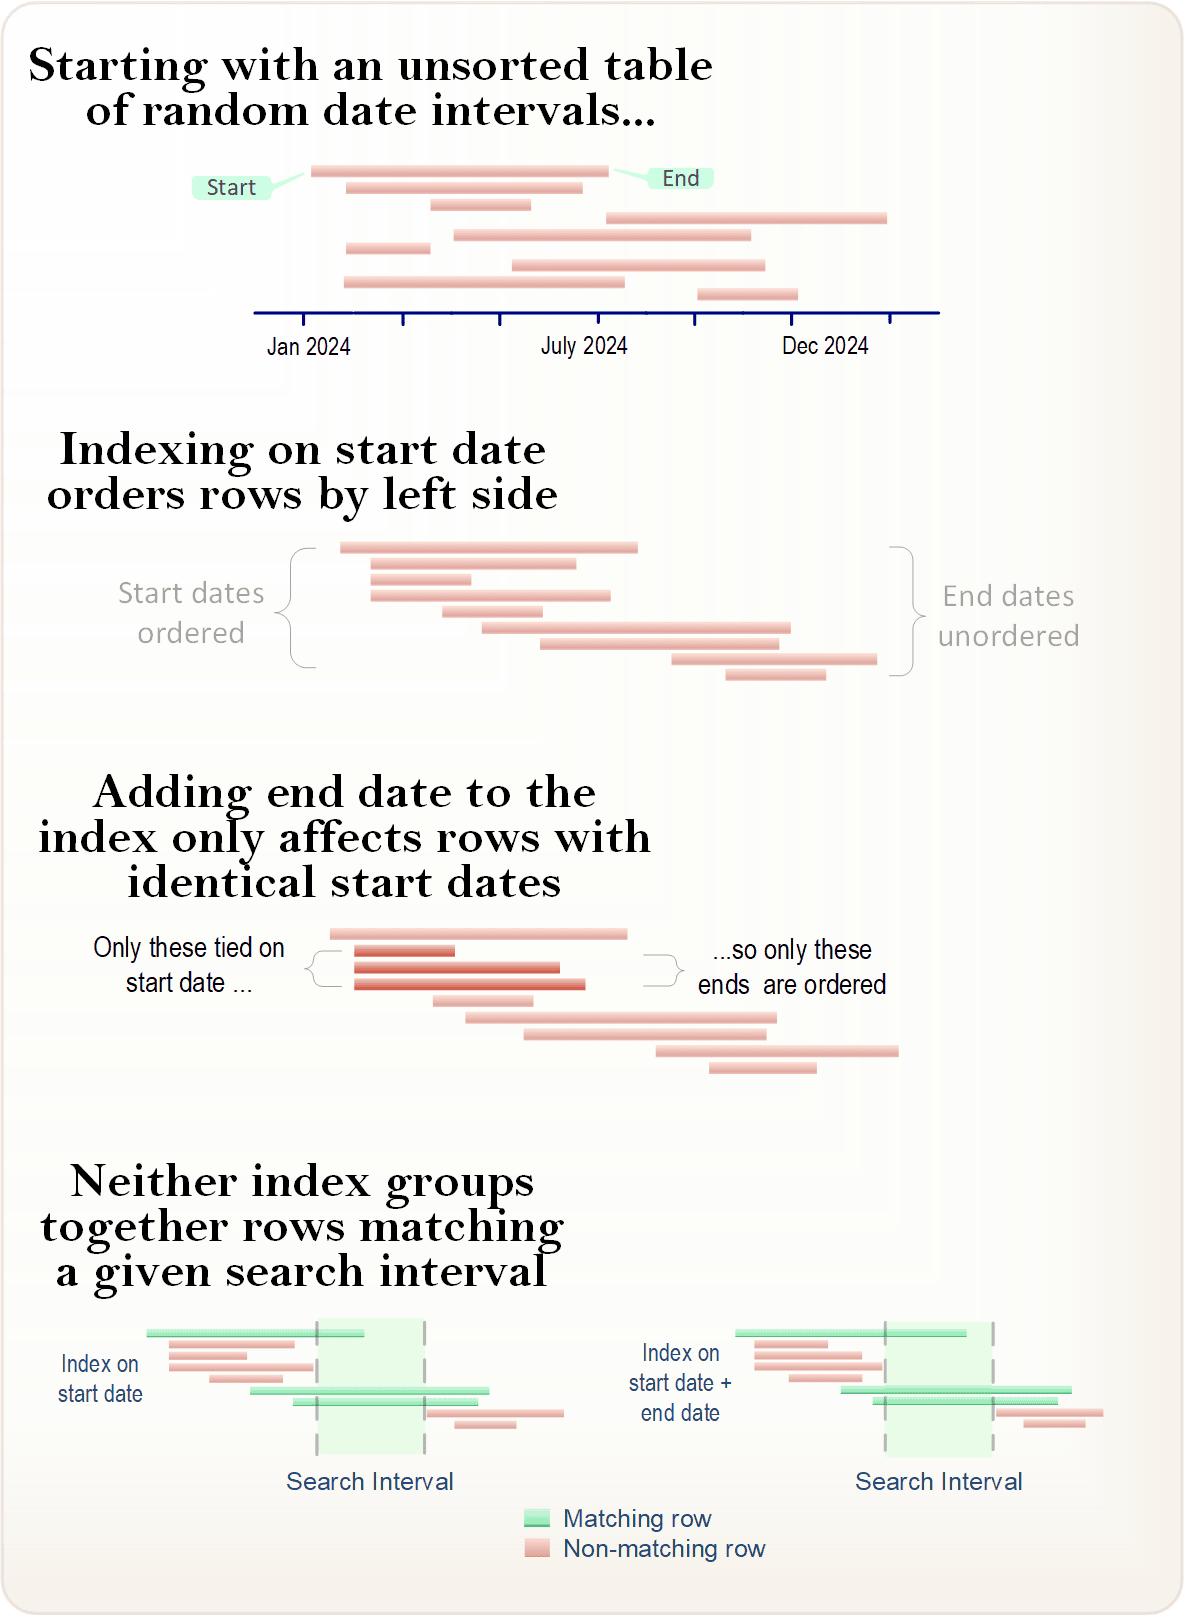
Like the name suggests, a B-Tree index contains a branching structure of values on the indexed column; traversing the tree allows one to find a specific value or any contiguous range of values. For composite (multi-column) indexes, the second column affects ordering only where the first column has multiple equal values: the second column acts as a “tie breaker”, as it were. Similarly, the third column comes into play only for ties on the second, and so on. This is easier to understand visually. See the following image:

Notice that our compound index (start date + end date) has little effect on row ordering compared to the simple single-column index. And neither one groups rows in a manner that allows us to quickly find all overlapping values. Rows which overlap our query range (shown in green ) aren’t in order, and so our index doesn’t help. The entire table must be scanned.
That’s bad enough when that interval is a fixed value, but when the interval comes from another table (or a self-join on the original table), it means every row in Table A must be matched against every row in Table B. In technical terms, this is quadratic performance — doubling the number of rows means the query must do four times the work. On very large tables, a query like this will hamstring even the most powerful servers.
A Cheap Trick
Before we look at a more sophisticated approach, there’s often an easy way to “hack” overlap queries. The idea is to give the QO (query optimizer) information that we have, but it doesn’t. In our example, the tables span years of timestamp values, but any single event is much shorter.
If we can identify a maximum duration for either type of event and pass that information onto the QO, it can scan a much smaller portion of the index. For example, in our data, no patron visit is longer than 4 hours. We can add this information to our query in the following manner:
|
1 2 3 4 5 6 |
SELECT * FROM patrons p CROSS JOIN outages o WHERE p.enter <= o.end_time AND p.enter >= o.end_time - '1 hour'::INTERVAL*4 --<< AND p.leave >= o.start_time; |
The new clause (suffixed with –<<) means there is now both a minimum and a maximum value on p.enter. This converts the statement into an (index-serviceable) range query. Assuming you still have an index on this column, the effects on query time is dramatic: it shrinks all the way from 26 seconds down to 0.1 second. Wow! Suddenly we have a practical query.
Instead of setting a maximum range on patrons, we could have done the same for outages. Or better, both tables. The query optimizer won’t use both at once, but it will use the one it believes to be most efficient.
The great advantage of this technique is that it allows you to use the indexes you likely already have. However, be careful! If any data ever exceeds this maximum duration, it will be incorrectly filtered from the results. For instance, a patron row with a duration of 6 hours will be invisible to this query, no matter how many outages it overlaps. If you use this method, ensure to base your durations on business rules unlikely to change, rather than simply assuming future events will be similar to those in the past.
GiST: The Way Forward
PostgreSQL offers an alternative to BTree indexes, called GiST. You may have encountered GiST indexes in connection with querying two-dimensional data like geometric objects or geographic regions. However, these indexes are equally adept at indexing one-dimensional date, time, and numeric ranges. GiST, which stands for Generalized Search Tree, is exactly what we need for cases like this.
To create the necessary index for our example, we form the two timestamps into a range type with the tsrange() function:
|
1 |
CREATE INDEX ON patrons USING GIST(tsrange(enter,leave)); |
GiST indexes also uses a special syntax to compare ranges for overlapping values: the ‘&&‘ operator. Using this operator, our query now looks like this:
|
1 2 3 4 5 |
SELECT * FROM patrons p CROSS JOIN outages o WHERE tsrange(o.start_time, o.end_time) && tsrange(p.enter, p.leave); |
That’s all there is to it. This query now runs in an execution time of 0.56 secs; nearly as fast as our “hack” from above. And unlike that method, this works correctly in all cases, even if some events have very long durations. There’s no need to worry about the occasional longer-duration event being incorrectly filtered out.
The GiST index converts our original quadratic-performance query to linear performance. We can see that by increasing our sample data row counts by a factor of 10. With one million patrons and 250,000 outages, the query time increases by the same factor, to 5 seconds, whereas the OVERLAP() query form would have taken several hours. But for extremely large tables, linear performance may still be too slow.
In Part II of this article, we’ll examine the possibility of further improvements.
Conclusion
A seemingly simple operation in SQL like finding overlapping values has some surprising pitfalls. Understanding how to form and optimize queries like this is something all SQL developers should know. Using the techniques above, you can achieve large performance gains, and satisfy performance-hungry users.
Appendix: Script to create Initial DB and populate with random data
|
1 2 3 4 5 6 7 8 9 10 11 12 13 14 15 16 17 18 19 |
-- -- This creates 100,000 patron visits, with a maximum -- stay at four hours, and 25,000 -- outages (the system is quite unreliable) each ranging -- from 1 to 30 minutes. -- INSERT INTO patrons (enter, leave) SELECT r, r + '1 minute'::INTERVAL * (1+RANDOM() * 120) FROM (SELECT NOW() – '1 minute'::INTERVAL * ROUND(RANDOM() * 15768000) AS r FROM generate_series(1,100000)) AS sub; INSERT INTO outages (start_time, end_time) SELECT r, r + '1 minute'::INTERVAL * (1+(RANDOM() * 30)) FROM (SELECT NOW() – '1 minute'::INTERVAL * ROUND(RANDOM() * 15768000) AS r FROM generate_series(1,25000)) AS sub; -- Delete any malformed random entries DELETE FROM patrons WHERE enter > leave; DELETE FROM outages WHERE start_time > end_time; |


Load comments