
With the release of SQL Server 2008, Microsoft introduced Extended Events, a system for collecting event-driven data about a SQL Server instance and its databases. The Extended Events feature required a smaller footprint than trace events and supported a robust programmatic interface that let you write customized tools to work with event information. However, SQL Server 2008 included no GUI that interfaced with the events directly. Instead, DBAs had to write complex T-SQL statements to gather the information they needed. And when they did, that information was returned as XML, not always the first choice for DBAs needing quick access to event data. Consequently, the Extended Events feature in SQL Server 2008 saw little adoption throughout the industry.
But SQL Server 2012 has proven to be a game changer. SQL Server Management Studio (SSMS) now includes a GUI component that makes working with Extended Events and viewing event-related data a series of intuitive and simple operations.
You manage extended events in SQL Server 2012 through the Extended Events node in the Object Explorer window, under the Management folder. If you expand the Extended Events node, you’ll find a Sessions folder. To collect event data in Extended Events, you must create and configure a session that specifies exactly what data to collect.
In this article, we’ll create a session that collects event information about T-SQL SELECT statements. The examples are based on querying data in the AdventureWorks2012 sample database-on a local instance of SQL Server 2012-but you can use any database to generate queries whose events you want to capture.
Creating an Extended Events Session
In the Sessions folder in Object Explorer, you’ll find one or two preconfigured sessions. By default, SQL Server 2012 includes the system_health session and, depending on which version of SQL Server 2012 you’re running, the AlwaysOn_health session. You can examine these sessions at your leisure, but for now, we’ll focus on creating a new session so you better understand how Extended Events works. Each session contains the same fundamental components.
To create a session, you can use the New Session Wizard or create the session manually. (You can also use T-SQL to create the session, but that’s what we’re trying to avoid.) For this article, we’ll create the session manually. The wizard makes it easier, but does not permit the granular control that a manual creation does. True, you can always access the session properties later to configure the session as you want, but by creating the session manually, you can configure the properties upfront if desired, and you gain a better understanding of how sessions work. Besides, once you’ve created a session manually, the wizard will be a breeze. So let’s get started with our session.
In Object Explorer, right-click the Sessions folder and then click New Session. When the New Session dialog box appears, the General page will be active, as shown in Figure 1. Type a name for your session in the Session name text box. I used Check Queries.
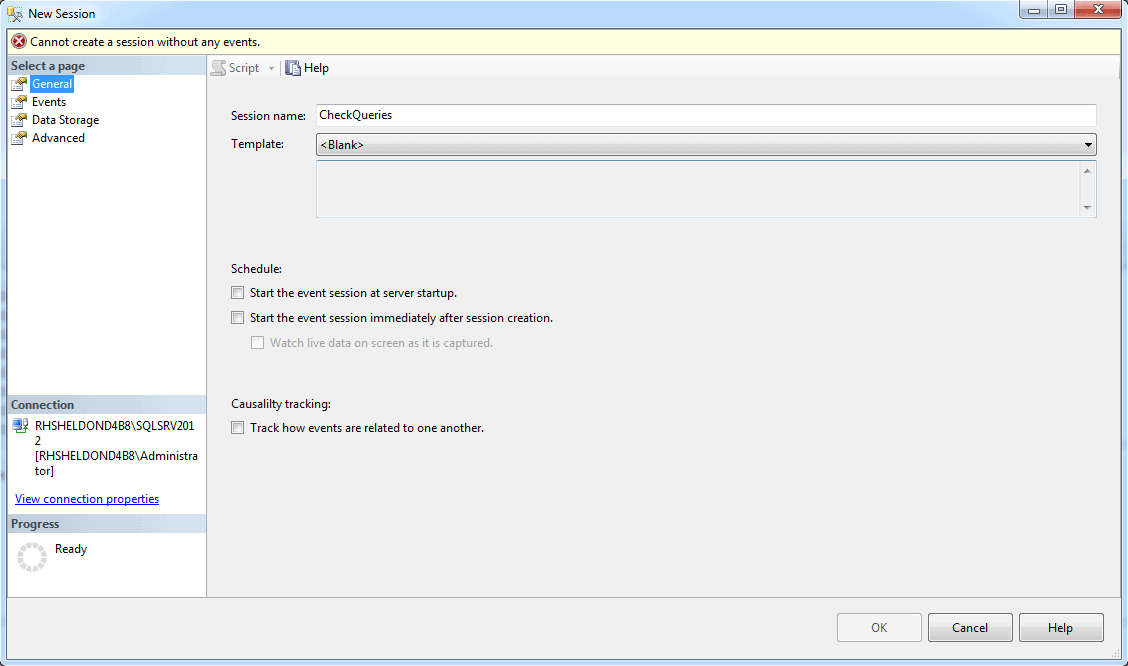
Figure 1: Creating an Extended Events session in SQL Server 2012
At this point, you don’t need to configure any of the other options on this page, but they’re worth noting. The first is the Template drop-down list. You can choose from a list of templates that preconfigure your session with event-related settings. For instance, you can use the Query Detail Sampling template to retrieve event data about T-SQL statements, stored procedures, and batches, along with other information. You can either modify the preconfigured settings-such as adding or deleting events-or use the settings as configured in the template. Once you save the session, you can’t change the template being used, but you can modify the properties as necessary.
For the most part, the other options on the General page should be self-evident. The only one that might not be clear is in the Casualty tracking section. The Track how events are related to one another option lets you track events across related tasks, when one task causes work to be done by another.
Once you’ve provided a name for your session, go to the Events page (shown in Figure 2) to select the events you want to monitor.
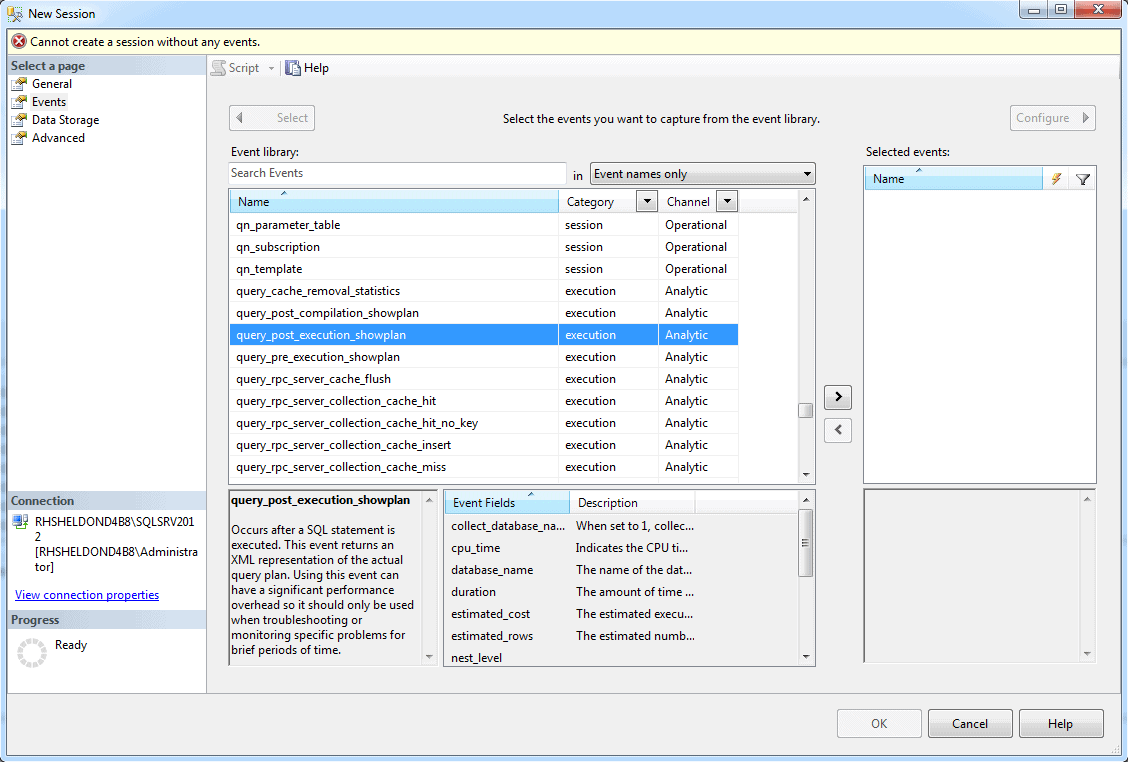
Figure 2: Adding events to an Extended Events session
If you select an event in the Event library grid, a description is listed below, along with a list of fields associated with the event. Each event is made up of a set of fields that provide specific information about the event. For example, in Figure 2, the query_post_execution_showplan event is selected. The event returns an XML representation of the query plan, along with details such as the database name and the query’s duration, as reflected in the list of fields.
To add an event to your session, select the event in the Event library grid, and then click the right arrow to add it to the Selected events grid at the right of the page. For this exercise, we’ll add the query_post_execution_showplan and sql_statement_completed events. Figure 3 shows what the Events page looks like after you’ve added the two events.
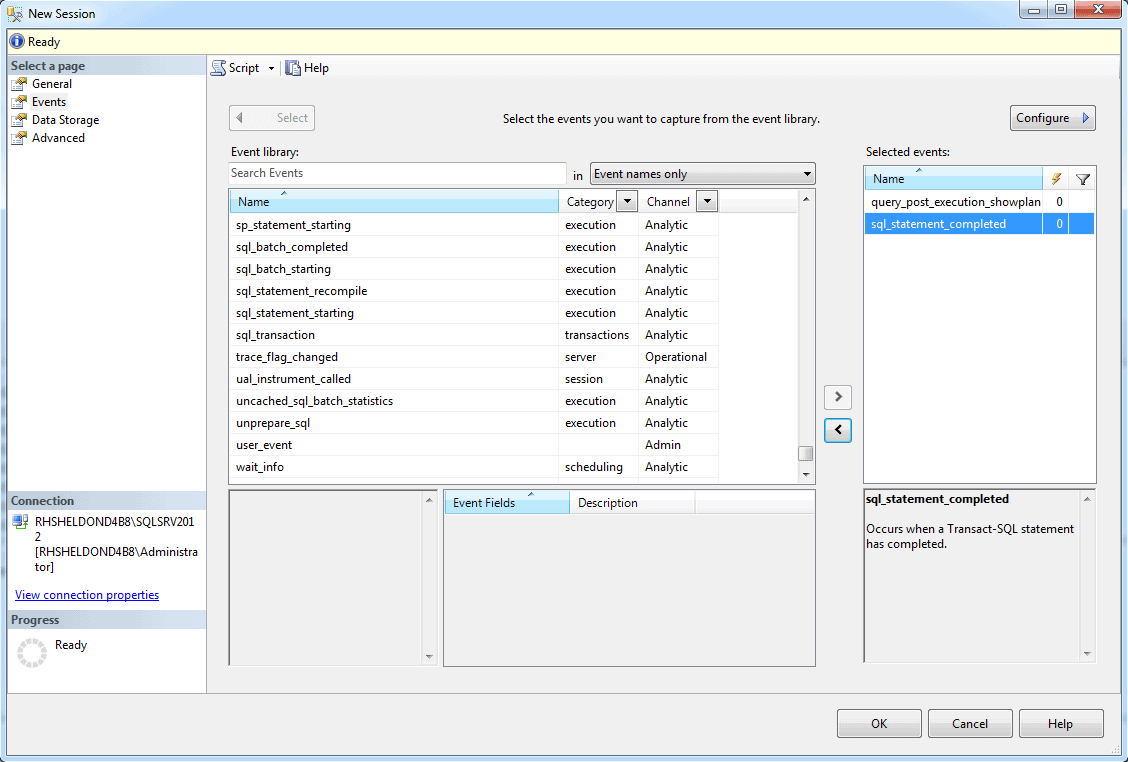
Figure 3: Viewing selected events in the New Session dialog box
When adding events to your session, remember that the process of tracking events comes at a cost, particularly an event such as query_post_execution_showplan. So select your events carefully and keep the tracking costs in mind when you run your sessions. Events that are particularly costly, like query_post_execution_showplan, usually come with a warning in their descriptions, so be sure to take note of those.
Otherwise, that’s all you need to do to set up a basic session. There are certainly more granular ways we can configure our session, which we’ll do later in the article, but first, let’s try out what we’ve done so far so you can see the session in action. Click OK to save the session and close the New Session dialog box. Your event should now be listed beneath the Sessions folder in Object Explorer.
The next step will be to test the session. To do so, you’ll need to run a few queries, unless you created your session on a SQL Server instance that’s actively being queried. On my system, I created the following queries to run against the AdventureWorks2012 database:
|
1 2 3 4 5 6 7 8 9 10 |
SELECT * FROM Production.TransactionHistory ORDER BY TransactionDate DESC, ReferenceOrderID, ReferenceOrderLineID; SELECT * FROM Person.Person WHERE BusinessEntityID <> 100 OR BusinessEntityID <> 200 ORDER BY PersonType, Lastname, FirstName; SELECT * FROM Sales.Currency ORDER BY Name; |
Once you’ve gotten your queries ready to go, right-click the new event and click Start Session. Then right-click the event again and click Watch Live Data. This opens a tab in SSMS that displays the events in the upper pane and details about each event in the lower pane. Now run your queries. Your results should look similar to those shown in Figure 4.
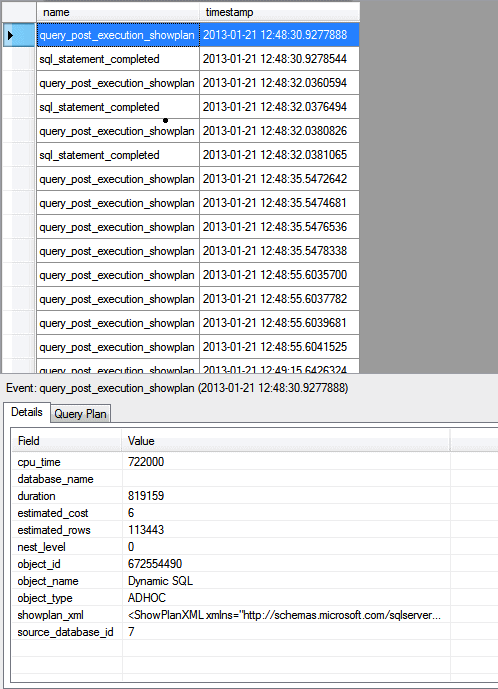
Figure 4: Viewing a query_post_execution_showplan event
On my system, the session recorded one sql_statement_completed event for each statement I ran, one query_post_execution_showplan event for each of those statements, and numerous other query_post_execution_showplan events related to SQL Server management.
Along with the list of events, you can view details about an event by selecting the event in the top pane. For example, the first query_post_execution_showplan event shown in Figure 4 is selected. Below you can find details about the event, broken down by field, such as duration, estimated_rows, and showplan_xml. If you double-click the showplan_xml value, the XML will open in its own tab, rendered in a more readable format.
Figure 5, on the other hand, shows the details of the first sql_statement_completed event to be recorded in my session. The event includes some of the same fields as the previous one, but additional fields as well, such as physical_reads and row_count.
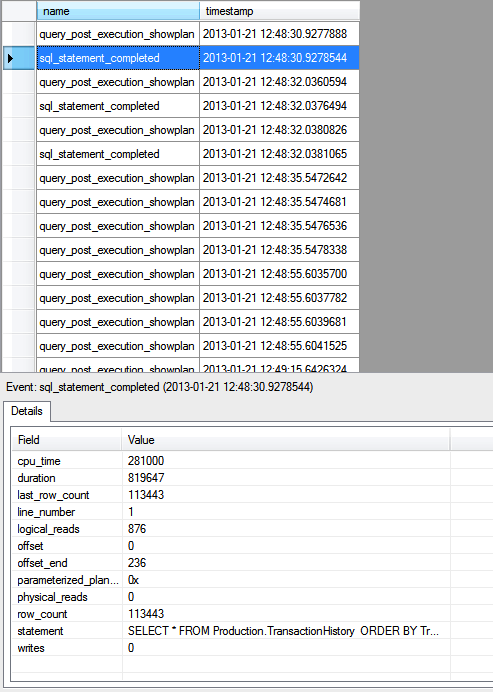
Figure 5: Viewing a sql_statement_completed event
If you double-click the value of a non-XML field, the field’s value will be displayed in its own window. For example, Figure 6 shows the value of the statement field. The value in this case is the SELECT statement that generated the event.
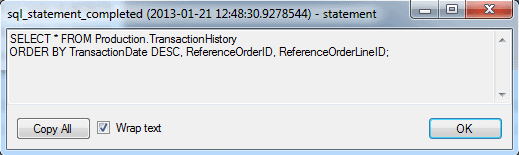
Figure 6: Viewing the T-SQL statement in a sql_statement_completed event
Although we added only two events to our session, we still receive plenty of information about our query executions. However, if we keep the session running, we’ll end up with a lot more events than we want or need. To prevent this from happening, we can add filters to our session to limit the returned events to those that most interest us.
Adding Filters to a Session
Filters let you limit the number of events you return based on specified criteria. Before adding any filters to your session, first close the Live Data tab and then, in Object Explorer, right-click the session and click Properties. In the Session Properties dialog box, go to the Events page and click the Configure button in the top-right corner. You should be presented with a screen that lets you select fields and configure filters. Go to the Filter (Predicate) tab and select the query_post_execution_showplan event in the Selected events grid, as shown in Figure 7.
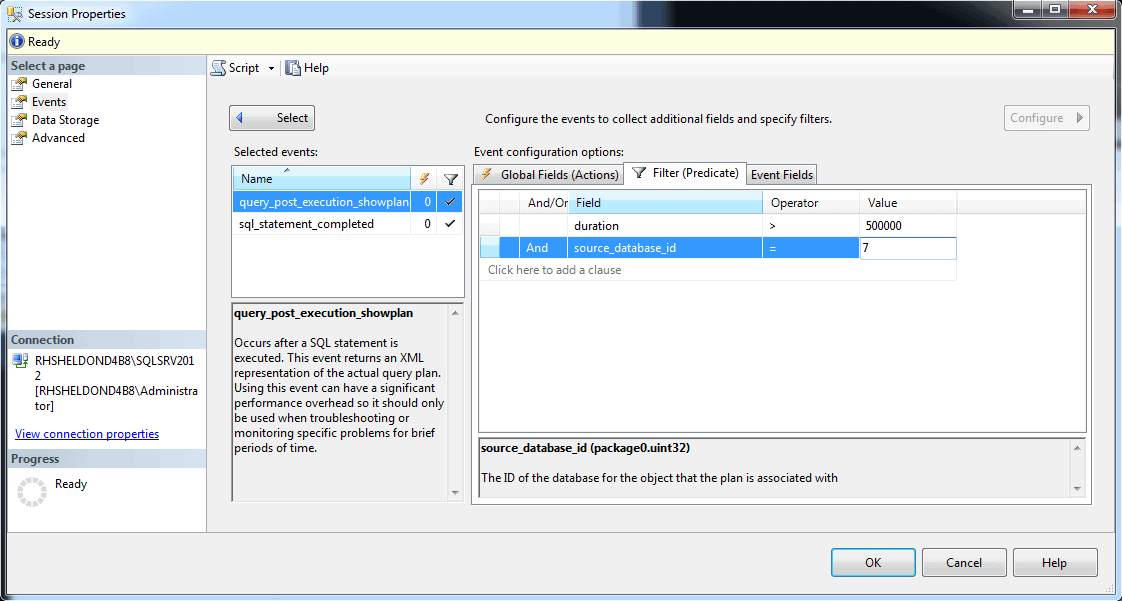
Figure 7: Adding filters to the query_post_execution_showplan event
You create filters based on the selected event. To create a filter, you specify a field, operator, and value. The events returned must match these criteria. For example, notice in Figure 7 that I’ve added two filters for the query_post_execution_showplan event. The first filter specifies the duration field, the greater-than (>) operator, and the value 500000. As a result, for a query_post_execution_showplan event to be returned by the session, it must have a duration value greater than 500,000 microseconds. This way, only longer running query_post_execution_showplan events are returned.
The second filter works in a similar fashion. It specifies that the source_database_id value must equal 7, which, on my system, is the ID assigned to the AdventureWorks2012 database. I added this filter so my session includes only query_post_execution_showplan events related to that database.
I next added a filter on the sql_statement_completed event, as shown in Figure 8. This is the same filter I added on the duration field for the query_post_execution_showplan event. As a result, only sql_statement_completed events whose duration is greater than 500,000 microseconds will be included in the session results.
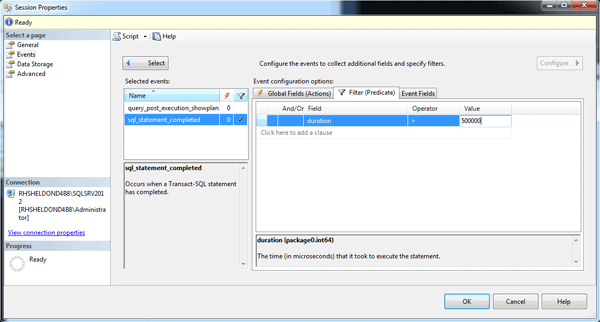
Figure 8: Adding a filter to the sql_statement_completed event
Once you’ve configured your filters, click OK to close the Session Properties dialog box, right-click the session in Object Explorer, and then click Watch Live Data. If necessary, run your T-SQL statements again, or wait for other statements to run. On my system, I ran the three queries, but only two of the statements returned events that were not filtered out, as indicated by the Live Data tab shown in Figure 9.
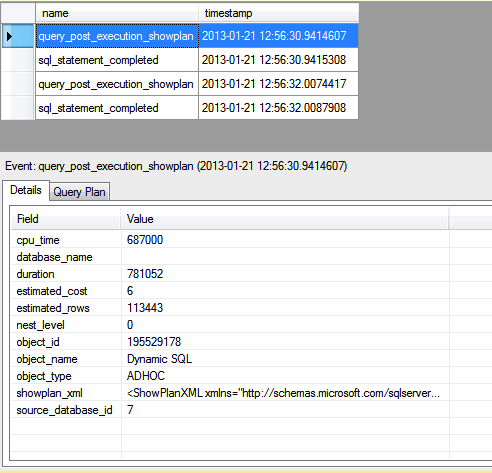
Figure 9: Viewing the filtered events in SQL Server Management Studio
Because only two of my SELECT statements ran over 500,000 microseconds, my session included only events generated by those statements. And because I limited query_post_execution_showplan events to the AdventureWorks2012 database, my session no longer includes all those extra query_post_execution_showplan events. As a result, my session now includes only two sql_statement_completed events and two query_post_execution_showplan events.
Your session results might be different from mine, but you can still see how useful filters can be to help ensure you’re returning only the data you want to return.
Adding Fields to a Session
Now let’s look at another way you can configure your session to include the information you need. Close the Live Data tab and again open your session’s properties. Once more, go to the Events page and click the Configure button. This time, however, go to the Global Fields (Actions) tab. Global fields, such as database_id or database_name, are fields available to multiple events. At times, it can be useful to add one or more of these fields to provide necessary information in an event. For example, it can be sometimes be difficult to know which query_post_execution_showplan event is associated with which sql_statement_completed event in our results. If we add the transaction_id field to each event we have a better idea how to associate the events.
To add a global field, select the event in the Selected events grid and then select the global fields you want to include. Figure 10 shows the transaction_id field selected for the query_post_execution_showplan event.
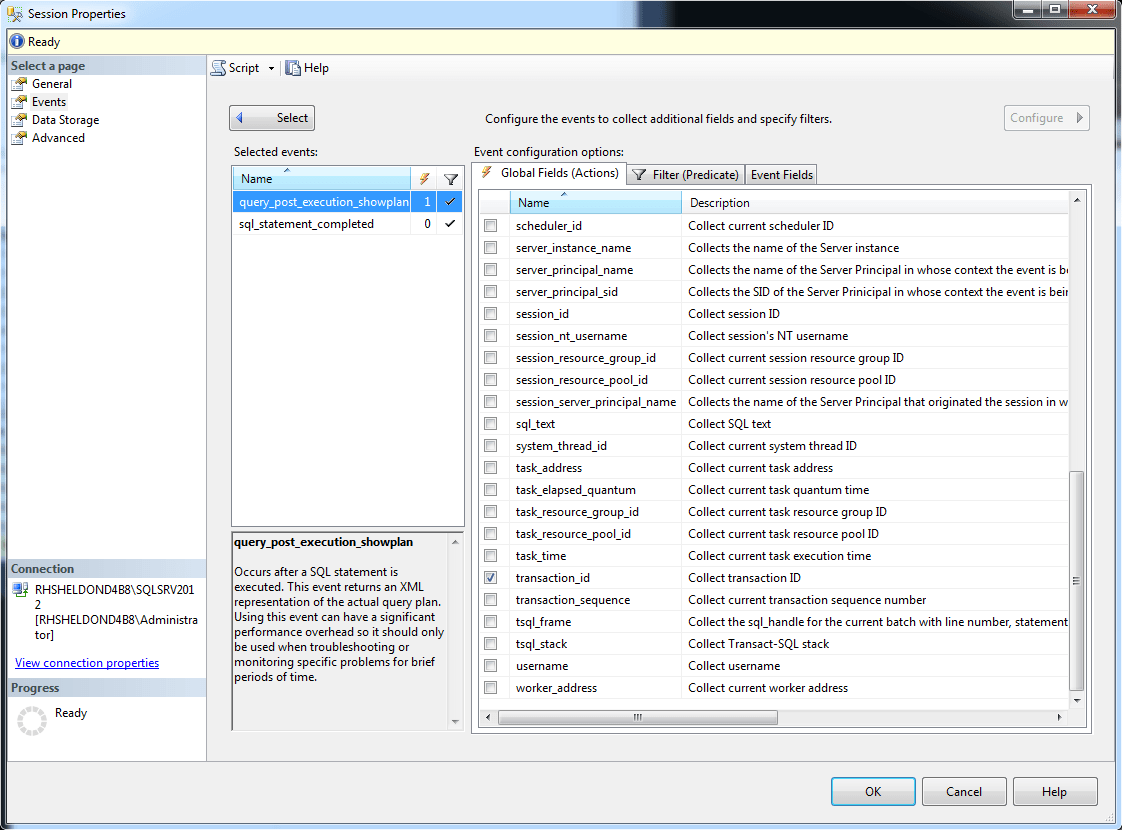
Figure 10: Adding a global field to the query_post_execution_showplan event
In some cases, you can also decide which event-specific fields to include. If you go to the Event Fields tab (with the query_post_execution_showplan event still selected), you can see that the database_name field is optional, as shown in Figure 11. You can choose to include the field or not. For this exercise, we’ll include it. Note, however, some fields are listed as global, but are also included in the event fields, as is the case with the database_name field.
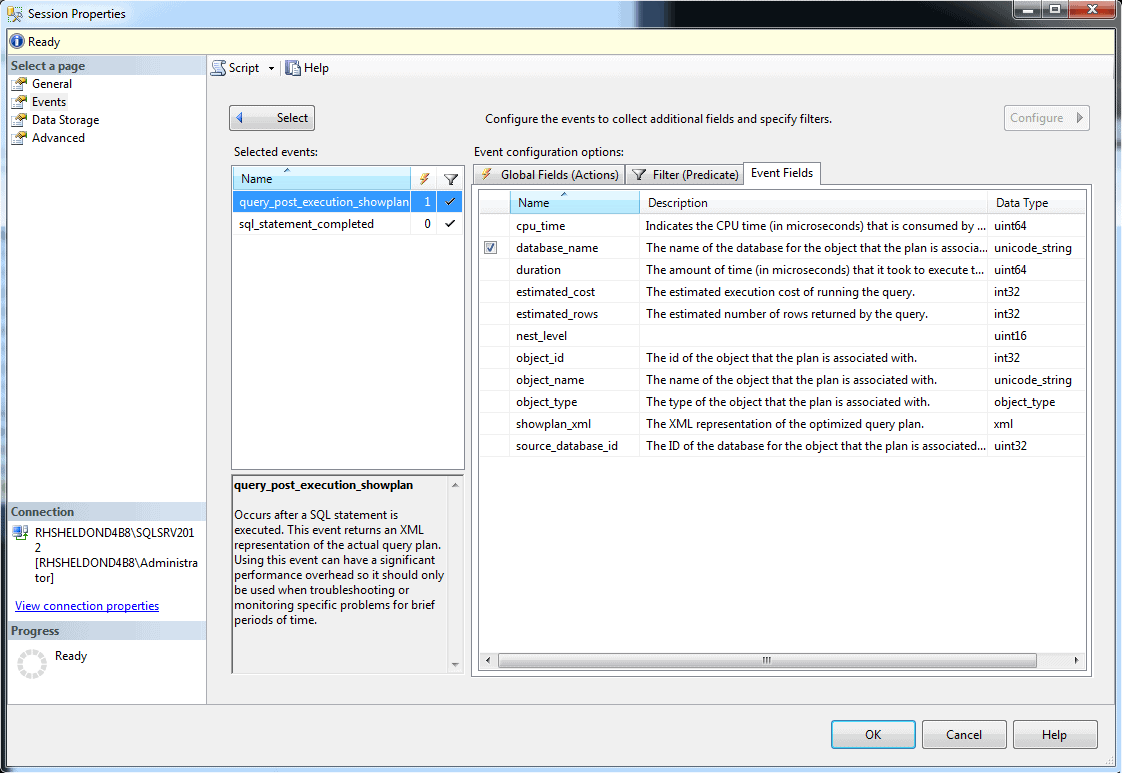
Figure 11: Adding an event field to the query_post_execution_showplan event
Regardless of where the field is listed, keep in mind that you should add fields only when necessary because any components you add contribute to the overhead, even if only slightly. You could argue, of course, that we do not need to include the database_name field on this event because our filter returns events only for one database. However, including the database name in this case is meant only to demonstrate how optional event fields work.
Now let’s repeat the process for the sql_statement_completed event. Select the event in the Selected events grid, go to the Global Fields (Actions) tab, and select the database_name and transactio n _id fields, as shown in Figure 12. (Note that, in this case, database_name is not included in the event fields.)
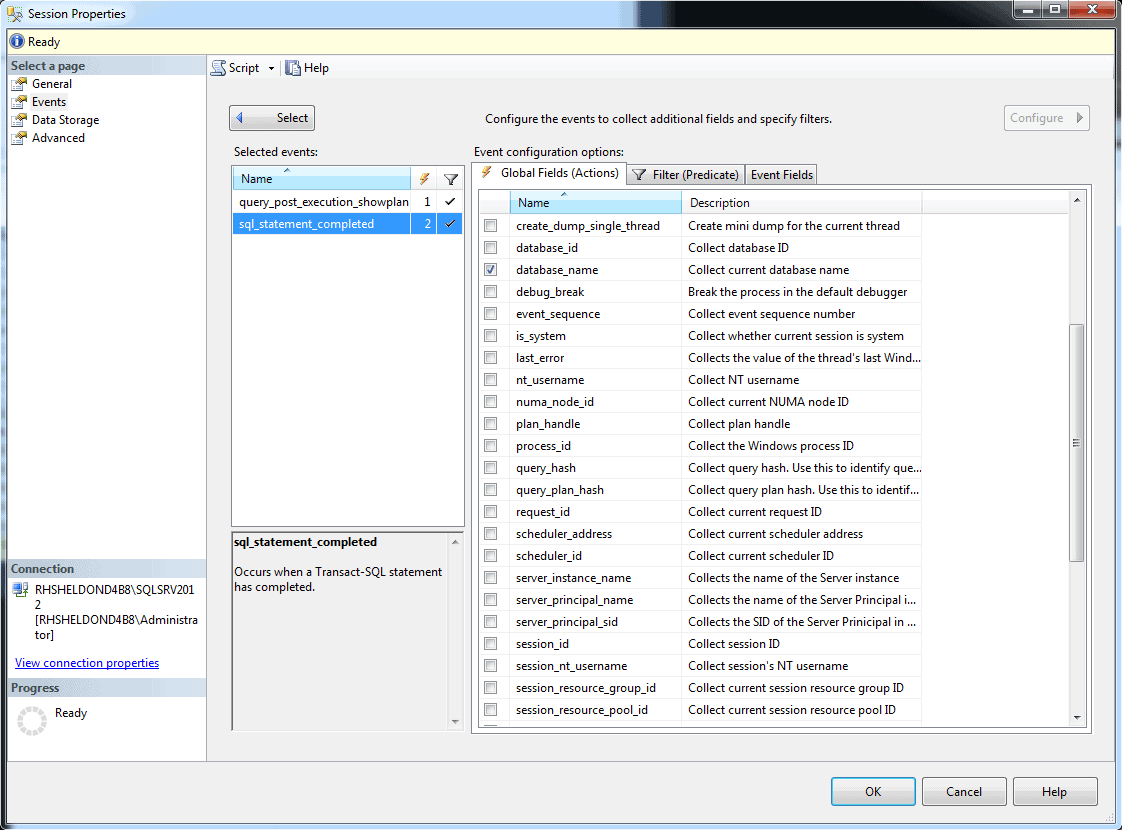
Figure 12: Adding global fields to the sql_statement_completed event
Now let’s look at the Event Fields tab associated with the sql_statement_completed event (shown in Figure 13). Notice that you can choose to include the parameterized_plan_handle field and statement field. By default, the first is not selected and the second is. For this exercise, we’ll stick with the default settings. Click OK to save your session and close the Session Properties dialog box.
Figure 13: Viewing event fields for the sql_statement_completed event
Next, launch the Live Data tab and run your test queries. Your session should include the same events as before; however, it’s when you view the individual events that you’ll see the difference. For example, Figure 14 shows the details for the first query_post_execution_showplan event. Notice that the information now includes the database name and a transaction ID, in this case, 309748.
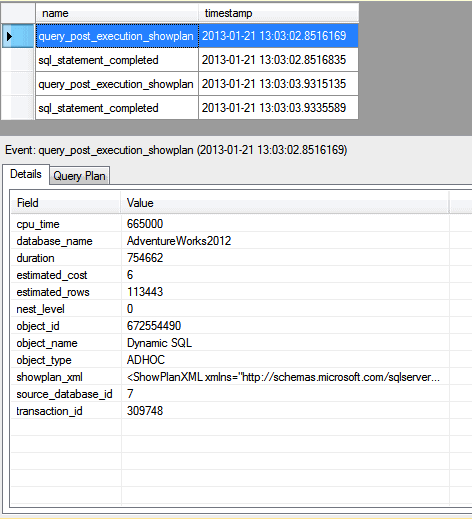
Figure 14: Viewing the transaction_id and database_name fields
My next event, sql_statement_completed, also shows a transaction ID of 309748, as well as the database name, both of which are shown in Figure 15.
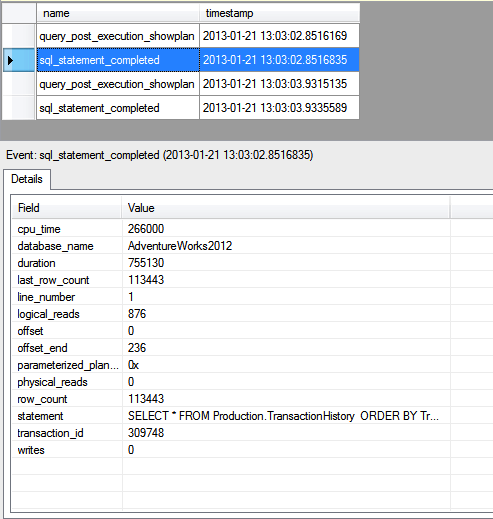
Figure 15: Viewing the transaction_id and database_name fields
As you can see, including the additional information can help to better understand what you’re looking at, where the data comes from, and how the pieces fit together. But so far, we’ve only looked at events as they’ve occurred. It’s time to learn how to capture and save that data.
Saving Session Data
Once again, close the Live Data tab and open the session’s properties, but this time go to the Data Storage page, as shown in Figure 16. Here you specify how you want to capture event data so you can save it for later viewing.
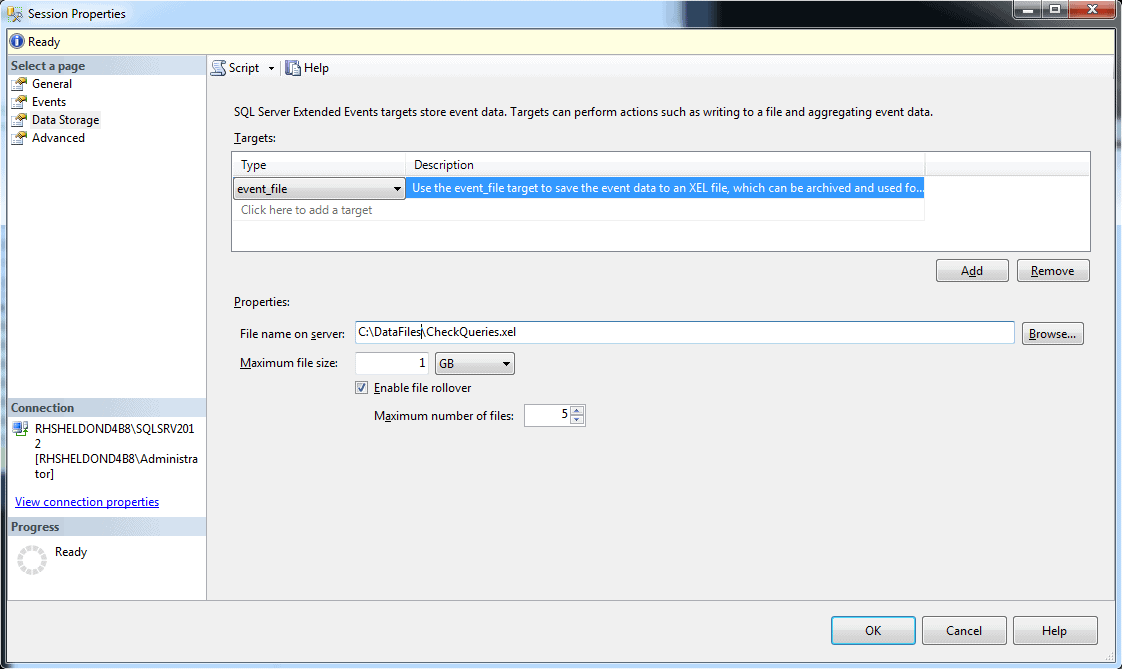
Figure 16: Adding data storage to an Extended Events session
SQL Server lets you save your session events in a number of formats:
etw_classic_sync_target:Outputs events in an Event Tracing for Windows (ETW) format.event_counter :Outputs events to memory in order to track the number of times an event has occurred during a session.event_file :Outputs events to a file saved to a folder on a disk.histogram :Outputs events to memory in order to group and count events based on fields or actions.pair_matching :Outputs events to memory in order to track events that don’t have a corresponding event based on the target configuration.ring_buffer :Outputs events to memory in order to track a limited amount of event data based on the target configuration.
When you select one of these data storage types, you’re presented with a set of options at the bottom of the page that let you further configure how to save the data. For this exercise, we’ll go with the event_file type. Select the type in the first row of the Targets grid and then specify a file path and name. On my system, I targeted the events to C:\DataFiles\CheckQueries.xel. (By default, Extended Events files use the .xel extension.) Then click OK to save the session and close the Session Properties dialog box.
Run your queries to ensure you’ve generated the necessary events. Next, in Object Explorer, expand your session’s node. Beneath your session, you should find a reference to the event file. On my system, the reference reads package0.event_fil e. Double-click the file node. This will open a new tab in SSMS and display the captured data similar to how it appeared on the Live Data tab, as shown in Figure 17. (You can also open the file by navigating to it through the SSMS File menu.)
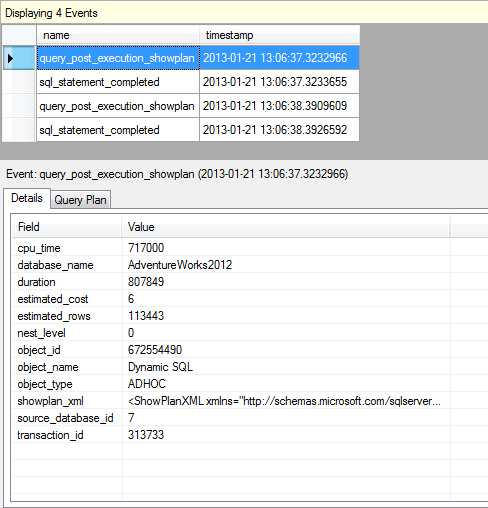
Figure 17: Viewing an event file for an Extended Events session
When you’re finished viewing the contents of the file, close the tab. Also, unless you specifically want to continue to capture data, you should stop your session. To do so, right-click the session and then click Stop Session. You can start it again whenever you want to capture more event data.
That’s all you need to do to create a session and capture event data. The Extended Events interface in SSMS makes this a fairly straightforward process. And as you can see from the number of events available-and other features we did not try out-we’ve only skimmed the surface. But you should now have seen enough to understand how easy it is to get started with Extended Events. And get started you should. With the release of SQL Server 2012, Microsoft announced the deprecation of SQL Server Profiler and SQL Trace, the event-capturing systems that Extended Events will slowly replace. You still have a while to make the transition, but now is a good time to get started.


Load comments