Introduction
Prefetching is often ignored by developers and DBAs when they are analyzing performance problems. After you’ve read this article I hope you will understand how prefetching works and why, and under what circumstances, this is so important for speeding-up your queries. I hope you’ll also be interested in the techniques and tools I’ve used to troubleshoot the problem, as they are useful for tracking a lot of other performance problems.
In short, prefetching is used to execute I/O operations in parallel, in a way that is somewhat similar to a read-ahead mechanism. It is used in the nested loops execution plan when there are more than a threshold number of rows in the outer input table. You can see whether prefetch is being used by viewing the property WithOrderedPrefetch or WithUnorderedPrefetch in the nested loops operator. Prefetching can be ordered or not depending on your query. In this article I’ll show the behavior of unordered prefetching. If you’re interested, you can use the links in the end of this article to read more about ordered prefetching.
Setting the environment
To demonstrate prefetching, I’ll start by creating a 500MB database on a USB flash drive:
|
1 2 3 4 5 6 7 8 9 |
USE Master GO CREATE DATABASE TestPrefetching ON PRIMARY ( NAME = N'TestPrefetching', FILENAME = N'H:\TestPrefetching.mdf' , SIZE = 512000KB , FILEGROWTH = 1024KB ) LOG ON ( NAME = N'TestPrefetching_log', FILENAME = N'H:\TestPrefetching_log.ldf' , SIZE = 1024KB , FILEGROWTH = 10%) GO ALTER DATABASE TestPrefetching SET RECOVERY SIMPLE GO |
With the database created, let’s create two tables in it, one called TestTab1 and another called TestTab2. After I create the tables, I’ll update the column ID_Tab1 with some random values. It is a very simple database in which the TestTab2 has a column related to the TestTab1.
After I create and populate the tables I’ll also update the statistics with fullscan to guarantee that the statistics are updated with the best precision.
The following script took almost 6 mins to run in my notebook.
|
1 2 3 4 5 6 7 8 9 10 11 12 13 14 15 16 17 18 19 20 21 22 23 24 25 26 27 28 29 30 31 32 33 34 35 36 37 38 39 40 41 42 43 44 45 46 47 48 49 50 51 52 53 54 55 |
USE TestPrefetching GO IF OBJECT_ID('TestTab1') IS NOT NULL DROP TABLE TestTab1 GO CREATE TABLE TestTab1 (ID Int IDENTITY(1,1) PRIMARY KEY, Col1 Char(5000), Col2 Char(1250), Col3 Char(1250), Col4 Numeric(18,2)) GO -- 6 mins to run INSERT INTO TestTab1 (Col1, Col2, Col3, Col4) SELECT TOP 1000 NEWID(), NEWID(), NEWID(), ABS(CHECKSUM(NEWID())) / 10000000. FROM sysobjects a CROSS JOIN sysobjects b CROSS JOIN sysobjects c CROSS JOIN sysobjects d GO 30 CREATE INDEX ix_Col4 ON TestTab1(Col4) GO IF OBJECT_ID('TestTab2') IS NOT NULL DROP TABLE TestTab2 GO CREATE TABLE TestTab2 (ID Int IDENTITY(1,1) PRIMARY KEY, ID_Tab1 Int, Col1 Char(5000), Col2 Char(1250), Col3 Char(1250)) GO INSERT INTO TestTab2 (ID_Tab1, Col1, Col2, Col3) SELECT TOP 1000 0, NEWID(), NEWID(), NEWID() FROM sysobjects a CROSS JOIN sysobjects b CROSS JOIN sysobjects c CROSS JOIN sysobjects d GO 10 CREATE INDEX ix_ID_Tab1 ON TestTab2(ID_Tab1) GO DECLARE @MenorValor Int = 1, @MaiorValor Int = 5000, @i Int SET @i = @MenorValor + ABS(CHECKSUM(NEWID())) % (@MaiorValor - @MenorValor) ;WITH CTE_1 AS ( SELECT ID, @MenorValor + ABS(CHECKSUM(NEWID())) % (@MaiorValor - @MenorValor) AS Col1 FROM TestTab1 ) UPDATE TestTab2 SET ID_Tab1 = CTE_1.Col1 FROM TestTab2 INNER JOIN CTE_1 ON CTE_1.ID = TestTab2.ID GO UPDATE STATISTICS TestTab1 WITH FULLSCAN UPDATE STATISTICS TestTab2 WITH FULLSCAN |
Let’s now check on the size of the tables we’ve created.
|
1 2 3 4 5 |
-- Checking table size sp_spaceused TestTab1 GO sp_spaceused TestTab2 GO |

As we can see, the table TestTab1 has 241 MB of data, and the table TestTab2 has 80 MB of data.
Testing
Now that we’ve created the test scenario, we can execute the join between the two tables.
|
1 2 3 4 5 6 7 8 9 |
CHECKPOINT DBCC DROPCLEANBUFFERS WITH NO_INFOMSGS GO SELECT TestTab1.Col4, TestTab2.Col1 FROM TestTab1 WITH(index=ix_Col4) INNER JOIN TestTab2 ON TestTab1.ID = TestTab2.ID_Tab1 WHERE TestTab1.Col4 < 0.8 OPTION (RECOMPILE) |
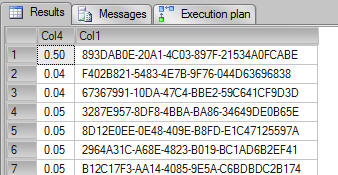
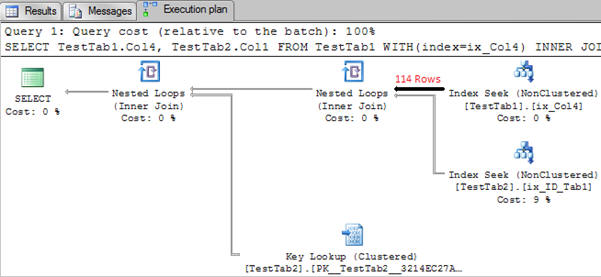
The query above takes less than 1 second to finish and return 42 rows. Here are the results and the actual execution plan:

Query Results

Execution plan with 114 rows being returned from table TestTab1

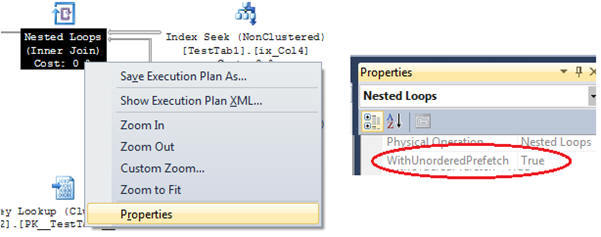
Prefetching is being executed by the Nested Loops operator
As we can see it is a very straightforward execution plan with two Nested Loops operators. Let’s start investigating it in more detail.
So how does the loop join work? For each row from the “outer table” (in this case the table TestTab1), search for the match in the “inner table” (TestTab2). For more details about how joins work, look at the links in the final section of this article.
There are 114 rows being returned from the TestTab1. For each row returned from the table TestTab1, SQL Server will execute an Index Seek on the TestTab2. This seek is a random read because the rows are being retrieved in the order of TestTab1.Col4.
To optimize the unordered I/O operations on the table TestTab2, it triggers many asynchronous I/O operations in parallel, rather than executing one I/O operation per row read on table TestTab1. You can see prefetching is being used because the nested loops property WithUnorderedPrefetch is set to true.
To compare the performance of this query without Prefetch, I’ll use the traceflag 8744 to disable the prefetch, and the command QUERYTRACEON to disable it only in the query scope.
|
1 2 3 4 5 6 7 8 9 10 |
CHECKPOINT DBCC DROPCLEANBUFFERS WITH NO_INFOMSGS GO SELECT TestTab1.Col4, TestTab2.Col1 FROM TestTab1 INNER JOIN TestTab2 ON TestTab1.ID = TestTab2.ID_Tab1 WHERE TestTab1.Col4 < 0.8 OPTION (RECOMPILE, QUERYTRACEON 8744) |
The query above also run under 1 second, the only difference from the first query we ran is that I’m now using the trace flag to disable the prefetch. Even though prefetch was not used (you can confirm it looking at the nested loops operator properties, the property), there was no performance difference.
Without prefetching, SQL Server will trigger the I/O requests at something similar to “row-by-row”. In other words, for every row that is read on TestTab1, it will request the I/O on the table TestTab2: When the I/O finishes, it will request another I/O operation for the second row and so on…
It is important to understand here that SQL Server always read pages from memory (buffer cache), it means if a page is not in memory, it will request the page to the disk subsystem, put it in memory and then, read from memory.
When using prefetching, many threads will request the required I/O operations concurrently, so that the I/O requests are likely to finish earlier, because it os running many requests at the same time. Like read-ahead, it means that when data needed to be joined, the chances of a page to be in cache (because the I/O operation already had finished and the page is in the buffer) is very closely to happen, and it means faster joins.
The key point here is to understand that because the pages are put in memory earlier in the query execution, when the join is processed it already has the pages in memory and don’t need to wait for the pages being read from disk. Again, it is the same principle from read-ahead.
Testing under disk pressure
To make things a little more interesting, what if we simulate the same behavior in a pressure disk subsystem? Let’s do it.
To simulate disk pressure I’ll use the SQLIO tool to read some data on my flash drive. SQLIO is a tool provided by Microsoft which can be used to determine the I/O capacity of a given configuration. It is very easy to setup and can give you valuable information about your disk system.
To understand more about how to use SQLIO read the link in the end of the article.
I’ll run the SQLIO with the following parameters:
|
1 |
sqlio.exe -kR -t16 -dH -s600 -b64 |

If you had never used SQLIO, here is the translation for the parameters used above:
- –kR means I’ll simulate Reads.
- -t16 means I want 16 threads running in parallel.
- -dH is the specification for the disk I want to use, in this case H:
- -s600 is the time in seconds I want to run the tests.
- -b64 is the block size I want to read the data, in this case I’m using 64kb
Now I have SQLIO using 16 threads reading data on my flash drive, so let’s run the query with prefetching again:
|
1 2 3 4 5 6 7 8 9 |
CHECKPOINT DBCC DROPCLEANBUFFERS WITH NO_INFOMSGS GO SELECT TestTab1.Col4, TestTab2.Col1 FROM TestTab1 INNER JOIN TestTab2 ON TestTab1.ID = TestTab2.ID_Tab1 WHERE TestTab1.Col4 < 0.8 OPTION (RECOMPILE) |

We can see from the profiler results that the disk the query is taking just 1.3 seconds to run, even with all that SQLIO stressing,
Now let’s see the query without prefetching:
|
1 2 3 4 5 6 7 8 9 |
CHECKPOINT DBCC DROPCLEANBUFFERS WITH NO_INFOMSGS GO SELECT TestTab1.Col4, TestTab2.Col1 FROM TestTab1 INNER JOIN TestTab2 ON TestTab1.ID = TestTab2.ID_Tab1 WHERE TestTab1.Col4 < 0.8 OPTION (RECOMPILE, QUERYTRACEON 8744) |

Now the same query without prefetch is taking 7.5 seconds to run; it is 7 times slower. Because the I/O operations are not running in advance, it is taking more time to finish.
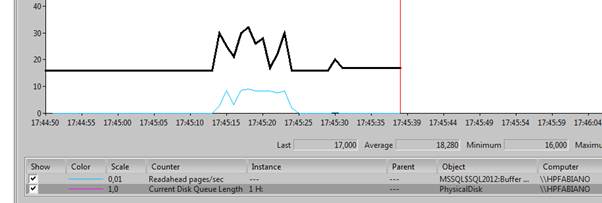
Another good way to analyze the prefetching performance is looking at the Current Disk Queue Length disk counter in the performance monitor. We can easily see that, when the query is using prefetching, the number of I/O requests in the queue is much higher than the same query without prefetching.
Let’s use the same query, but, this time, we force more disk reads: In other words, let’s join more rows.
|
1 2 3 4 5 6 7 8 9 10 11 12 13 14 15 16 17 18 19 |
CHECKPOINT DBCC DROPCLEANBUFFERS WITH NO_INFOMSGS SELECT TestTab1.Col4, TestTab2.Col1 FROM TestTab1 WITH(index=ix_Col4) INNER JOIN TestTab2 ON TestTab1.ID = TestTab2.ID_Tab1 WHERE TestTab1.Col4 < 50 OPTION (RECOMPILE, LOOP JOIN) GO CHECKPOINT DBCC DROPCLEANBUFFERS WITH NO_INFOMSGS SELECT TestTab1.Col4, TestTab2.Col1 FROM TestTab1 WITH(index=ix_Col4) INNER JOIN TestTab2 ON TestTab1.ID = TestTab2.ID_Tab1 WHERE TestTab1.Col4 < 50 OPTION (RECOMPILE, LOOP JOIN, QUERYTRACEON 8744) GO |
In the following screenshot, you can see the perfmon counter when the queries were running.

Looking at the counters we can see that when prefetching is used, SQL Server is triggering many read-ahead page operations, and the disk queue increases to perform the advanced I/O operations.
The first query finishes fast, and the query without prefetching is taking much more time to finish.
The real world problem
All of this can happen in your database when a plan without prefetching is re-used. As we know, SQL Server saves the plan of a query in the plan cache after compiling it. What if the plan saved in the cache is not using the prefetch, and then another execution reuses this plan?
If you know this can happens, in other words, sometimes I’ll join just a few rows, and another times I’ll join many rows, you should use a query hint (OPTIMIZE FOR, or RECOMPILE) to make sure you are getting the right plan.
You can see this in action on the following link: http://blog.sqlworkshops.com/index.php/prefetch/
It is important to mention that even though prefetching looks awesome for a system that is under IO pressure, it has a cost. When prefetching is used, SQL Server acquires locks on the index seek even when run at read uncommitted isolation level and, if necessary due to blocking operators in the plan, holds these locks until the end of the statement rather than releasing them immediately. You can read more about it in the Craig blog post. So be aware that, in highly concurrent applications, this extra locking can degrade performance.
Conclusion
Read-ahead prefetching is a very nice feature and should be used when needed. In other words, if you have an environment with waits related to I/O operations, a current queue performance counter low and avg disk reads per sec high it can mean that you are not prefetching data properly, the readahead pages/sec performance counter can also be useful here. In real world disk subsystems, problems can happen for many other reasons, but if you are facing a query without prefetching in the plan, and waiting for disk, this article may help you to tune it. Don’t miss the opportunity to read all the links from the references to understand it better.
That’s all folks.


Load comments