
.NET Memory management is an impressively complex process, and most of the time it works pretty well. However, it’s not flawless, and neither are we developers, so memory management problems are still something that a skilled developer should be prepared for. And while it’s possible to have useful information about .NET memory management and write better code without fully understanding the black box inside the framework, there are a few common misconceptions which need to be dispelled before you can really get started:
- A garbage collector collects garbage
- Doing lots of gen0 collections is bad
- Performance counters are great for understanding what is happening
- .NET doesn’t leak memory
- All objects are treated the same
Misconception #1: A Garbage Collector collects garbage
The run-time system has a notion of objects which it thinks it’s going to touch during the rest of its execution, and these are called the “live”, or reachable objects. Conversely, any object which isn’t live can be regarded as “dead”, and obviously we’d like to be able to reuse the memory resources that these dead objects are holding in order to make our program run more efficiently. So it is perhaps unintuitive that the focus of the .NET Garbage Collector (the GC, for short) is actually on the non-garbage; those so-called Live Objects.
One of the essential ideas behind the GC strategies that most people implement is that most objects die young. If you analyze a lot of programs, you find that, typically, a lot of them generate temporary objects while they’re doing some calculation, and then produce some other object to represent the results of that calculation (in some fashion). A lot of these young objects are therefore temporary, and are going to die quite quickly, so you want to design your GC to collect the dead items without having to process them all individually. Ideally, you’d like to only walk across the live objects, do something with those to keep them safe, and then get rid of all the objects which you now know are dead without going through them all one by one.
And this is exactly what the .NET GC algorithm does. It is designed to collect dead items without processing them individually, and to do so with minimal disruption to your system as a whole. This latter consideration is what gave rise to the generational model employed by the .NET GC, which I’ll mention again shortly. For now I’ll just say that there are three generations, labeled Gen0, Gen1 and Gen2, and that new objects are allocated to Gen0, which we’re going to focus on as we take a look at a simple example of how the GC works:
A Simple Mutator:
We’re going to try and illustrate what I’ve just explained using a simple C# program; a Mutator, as it’s called. This program makes an instance of a collection, which it then assigns into a local variable, and because this collection is assigned to the local variable, it’ll be live. And because this local variable is used throughout the execution of the While loop you can see below, it’ll be live for the rest of the program:
|
1 2 3 4 5 6 7 |
var collect = new List<B>(); while(true) { collect.Add(new A()); new A(); new A(); } |
Listing 1 – A simple mutator
What we’re doing is allocating three instances of a small class we’ve called A. The first instance we’ll put into the collection; it will remain live because it’s referenced by the collection, which is in turn referenced by the local variable. Then the two other instances will be allocated, but those won’t be referenced by anything, so they’ll be dead.
If we consider how this allocation pattern looks when we study Gen0, we’ll see it looks something like this:
Allocation in Generation 0

Figure 1 – A hypothetically empty Generation 0
Here we’re assuming that Gen0 is empty at the point when our function starts running. Now of course that isn’t ever true; when you start the CLR up, the base class libraries are loaded right away, and they allocate a lot of objects on the heap before the point at which your program runs. We’ll ignore those for the moment (for the sake of clarity), and we’ll also ignore the collection object that we assigned to that local variable in our first step.
So let’s look at the While loop, which we know is allocating 3 instances every time it iterates – we’ve coloured the instance that is referenced by the collection black to mark it as a live object, and then the two other instances, which are the dead objects, are coloured red.

Figure 2 – The initial allocations by the simple mutator (not to scale)
We’ll obviously have the same pattern in the second iteration; allocate one live object, followed by two dead objects – and then the third iteration will be the same again. Looking at Figure 3, you can clearly see that, as we go into the fourth iteration, we’ll find we have no more space left in Gen0, so we’ll need to perform a collection.

Figure 3 – Generation 0, filled to capacity
No Space? Copy
When dealing with Generations 0, 1 and 2 (i.e. the Small Object Heap) the .NET CLR uses a copying strategy; in this instance, it tries to promote the live objects out of Gen0 and into Gen1. The idea is to find all of the live objects in Gen0 and copy them into some free space within Gen1 (which we’re also assuming is empty, for clarity). Bear in mind that this is just the first step in the collection process, which applies in the same way when the GC is working from Gen1 to Gen2, and is illustrated using the arrows below:

Figure 4 – Copying live objects from Gen0 to Gen1 (or Genn to Genn+1)
At this point, the GC needs to go through other objects on the heap which reference our instances (such as our collection object), and fix up the pointers from those objects to now point to the new place where the referenced objects have been copied to.
This is a slightly tricky step, because at the point where the GC is copying the objects, it needs to also make sure that no threads are actually manipulating those contents. If they were, then it might miss updates that were made to the “old” versions of the objects after it had copied them, or it might actually modify pointers between objects in such a way that it forgets to copy some object forward.
In order to manage this, the .NET runtime brings the threads to what’s known as “safe points”. Essentially, it stops the threads and gives itself an opportunity to redirect these pointers from old objects in Gen0 to the newly created copies in Gen1.
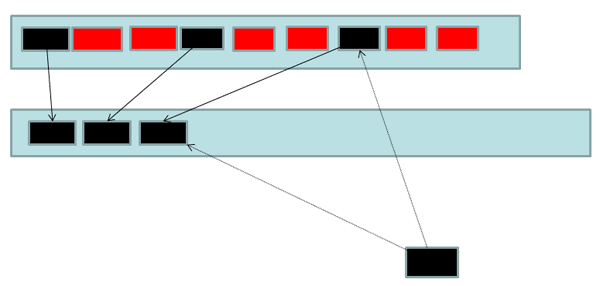
Figure 5 – Updating pointers to reference the newly copied object, one Generation up.
Of course, the cool thing is that once the GC has done that, it can now recycle the whole of Gen0, and can do so without individually scanning the objects that it used to hold. After all, it knows that the live objects have been safely promoted and are correctly referenced, and everything else is dead, and thus irrelevant. So, assuming most objects die young, we’ve only had to process a very small number of objects in order to recycle the whole of Gen0.

Observations
- The basic trick behind the .NET Generational GC is that objects are allowed to move (or rather, are copied). This is a great way to get them out of the way so that we can reuse their memory without having to process every object individually. It also means that the amount of time needed to perform a collection is proportional to the number of live objects which the GC has to move, rather than the number of dead objects in memory, which it’s going to ignore anyway.
- However, as a result of this system, we do have an overhead of needing to get all threads to a safe point. Where we can fix up the pointers to reference the location where each object is copied to. This obviously has repercussions on the design of the run-time. For example, you need to have access to data that you get from the JIT and from the program itself, telling you the offset between the various objects at which you might find pointers, so that you can a) scan them to find the live objects, and b) fix those up at some later time.
- A term you occasionally hear associated with this promotion policy and its effects is “bump allocation“, which just means that we have the handy ability to allocate things very quickly.
If Gen0 starts out completely blank then, when we want to allocate our first object, what we have to do is increment the pointer which is initially pointing to the beginning of the generation by a number of bytes corresponding to the size of that first object. That way, we then know that we can immediately place the next object at that newly offset location, and move the pointer along by the size of that object, etc. This gives us that clean, stacked layout which we saw in the earlier figures, where the objects all occur one after the other.
Now it turns out that it’s not quite as easy to do all that as you might think, because there can be multiple threads, and if you want to avoid locking during the allocation of the object and incrimination of the pointer, you need to do some trickery to ensure that you don’t need to do any thread locking on the fast path (the path you normally take). This is mentioned in more detail in the downloadable webinar that accompanies this discussion, but I won’t go into it here.
One Other Trick
There is another trick that the .NET runtime uses for small objects (i.e. < 85k1), and that’s the generational structure which we’ve already encountered. It divides the objects into Gen0 (where it puts the new objects), Gen1 & Gen2 (the latter being where the very old objects go, moving up the generations with each garbage collection they survive). In other words, it assumes that the longer objects survive garbage collections, the longer they are likely to keep surviving. Bearing in mind what I said earlier about how most objects die young, this structure means that the GC can focus its attention on doing GCs of just Gen0 (i.e. just a sub-set of the available memory), which is where we expect to get the greatest return in terms of recycling dead memory.
1 Objects which are > 85k in size are another matter altogether, and we won’t worry about them for now.
Misconception #2: Lots of Gen0 Allocation is Bad
This myth is almost an extension of the material that we’ve looked already at. We’ve seen that the time to do a Gen0 collection is proportional to the amount of live data in that Generation, although there are some fixed overheads for bringing the threads to a safe point. Moving lots of objects around is an expensive thing, but just doing a Gen0 collection is not necessarily an inherently bad thing. Imagine a hypothetical situation whereby Gen0 became full, but all the objects taking up the space were dead. In that situation, no live objects would be moved, and so the actual cost of that collection would be minimal.
The basic answer is that doing lots of Gen0 collections is very probably not a bad thing to do, unless you’re in the situation where all the objects in Gen0 are live, in which case you end up allocating them first to Gen0, and then immediately copying them up to Gen1 (known as double allocation).
Misconception #3: Performance Counters are Accurate
Windows comes with a notion of a Performance Counter; this is just some statistic that gets periodically updated by the system, and you can use tools to look at these values to try and deduce what’s happening inside the system. The .NET framework offers a number of these, which you can use various tools to take a look at in pseudo-realtime.
From the point of view of memory management, using these performance counters can give you a feel for whether your application is behaving like a “typical” application, and objects are dying young. If you’re curious about what “typical” means, the various bits of Microsoft documentation available online collectively have a reasonably good measure. For example, it is commonly stated that you should probably expect a ratio of Gen1-to-Gen2 collections of about 10:1.
There are very useful performance counters, which we’ll touch upon later, which are to do with allocation rates. Examples of these include the values of “Bytes in all heaps” (which tells us the total amount of all allocated objects), “time spent in GC”, and “allocated bytes per sec”, all of which we can graph through the freely available Perfmon tool.
Essentially, there’s a lot of data you can get to, which is all being maintained by the system to give you, as I mentioned, a sort of pseudo-realtime feel for how your application is behaving. On the face of it, that’s fine, but we’ve listed this as a misconception because there are a couple of problems with the way your data is collected and displayed.
Periodic Measurements
First of all, it’s important to remember that these counters are updated periodically, and in particular the .NET memory ones are only updated when a collection happens. That means that if no collection is happening, then the counter is stuck at its current reading. This means that things like the average values you see in Perfmon are not really telling you exactly what’s happening inside your application, although they’re admittedly better than nothing.
To demonstrate some of this, I’ve written a simple C# program that has the same basic structure that we saw before: we make a collection object, assign it to a local variable, and we allocate instances of a small class. This program class will take about 12 bytes on x86. However, we constrain the allocation rate, and only allocate one of these objects once every millisecond. Naturally, with this accumulation, and given the capacity of Gen0 being 1 or 2 MB, it’s going to take quite a few seconds before we fill Gen0 up and provoke a collection:
|
1 2 3 4 5 6 7 8 9 10 11 12 13 14 15 16 17 |
class Program { static void Main(string[] args) { var accumulator = new List<Program>(); while (true) { DateTime start = DateTime.Now; while ((DateTime.Now - start).TotalSeconds < 15) { accumulator.Add(new Program()); Thread.Sleep(1); } Console.WriteLine(accumulator.Count); } } } |
Listing 2 – A simple C# allocating objects at a constrained rate
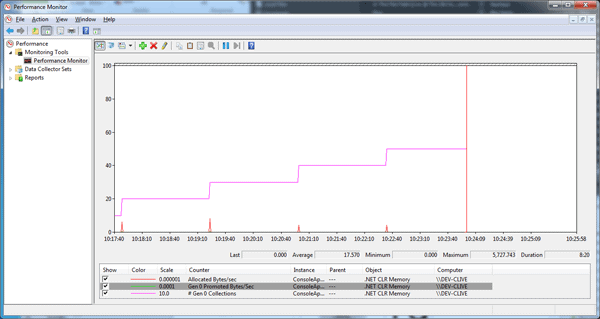
Figure 7 – Apparently spiking allocations.
If you look at such a program running under Perfmon, instead of seeing a constant allocated bytes per sec counter (which is what we know our program is actually doing), due to the periodic nature of the measurement driving the counter, it looks as if the allocation rate is just spiking whenever collections happen.
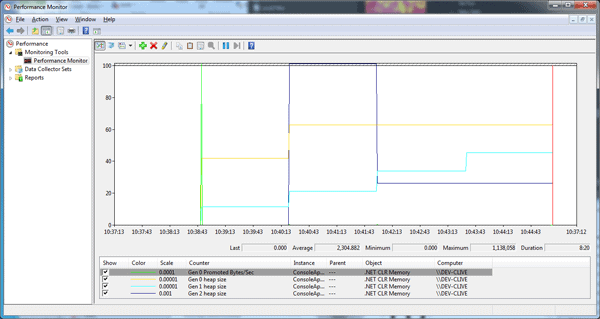
Figure 8 – Visualizing the varying generation sizes.
It’s also important to remember that the runtime itself is measuring what’s happening. Every time a collection happens, it works out what percentage of the objects survived in order to adapt, choosing optimal sizes for the various Generations, and trying to maximize throughput.
So, if you graph some things, like the various heap sizes, you’ll find you get misleading figures. For example, you can see in Figure 8 that the system decided to enlarge Gen2 by a massive amount, and then chose later to shrink it down again. In short, even though Perfmon is giving us this pseudo-realtime feel, what it shows us is not necessarily exactly how the application itself is behaving.
Getting Lower
In order to really see how your application is behaving, you need to dive into it and look at things at the object or type level, and there are several ways to do this.
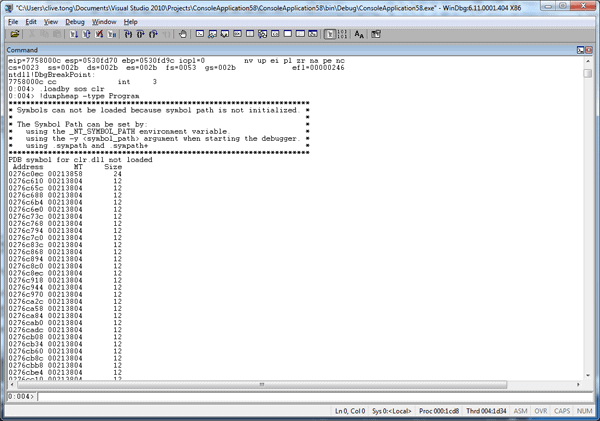
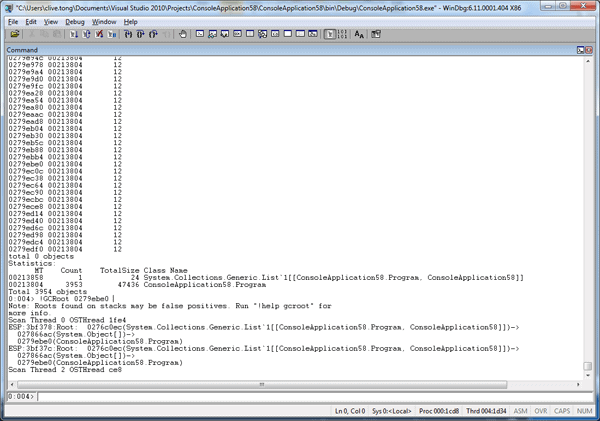
Figure 9 – Investigating memory at the object level with WinDbg.
Figure 10 – Investigating memory at the object level with WinDbg.
The first one, which is illustrated in Figure 9 and Figure 10, is to use WinDbg, which is part of the debugging tools for windows, and which you can attach to a running executable. The .NET framework itself comes with a debugger extension, called SOS, which you can load into WinDbg and which then allows you to scan the heaps and find details about the objects they contain. Essentially, loading that DLL makes a whole set of extra commands (which know about .NET memory layout) available to the debugger. In Figure 10, for example, we’re dumping all objects of the type program, and it will tell us (for example) that there were 3953 instances of that type on the heap at the point when I took this snapshot. It will also show us that each instance is taking up 12 bytes of memory.
Now, if we consider a particular instance, we can use commands like GCRoots to try and relate that object back to the root that’s actually keeping it in memory, and that path will show us how it’s being kept alive, which can be pretty useful information.
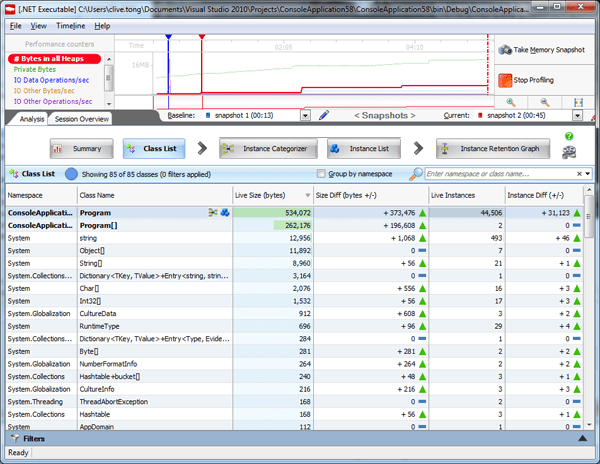
Figure 11 – ANTS Memory Profiler displaying performance counters.
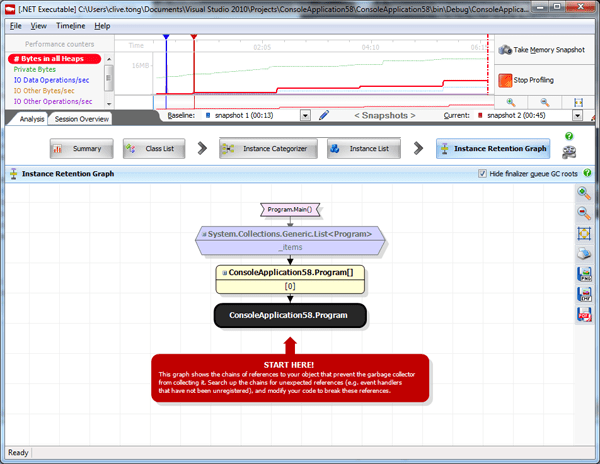
I just want to quickly mention in passing that there are other tools that allow you to do this – I’ll inevitably nod to our own ANTS Memory Profiler as an example. All of these tools try to make it easier to deal with the vast amount of information available in memory debugging. In the case of ANTS, it tries to first show us the information from the various performance counters at the top of the screen (See Figure 11 above) in order to guide us to a point in time at which we might want to take a snapshot (which is a dump of all the objects in the heap). The profiler then has tools to allow you to compare your snapshots to try and work out which objects have survived unexpectedly, and which objects have been allocated in vast numbers when you don’t expect it. It also allows us to do the root-finding trick we saw a moment ago, but in a much more graphical way (see Figure 12).
Figure 12 – Using ANTS Memory Profiler to find an objects roots
So, to wrap up the discussion of performance counters, you can use WinDbg, which gives you lots of information but is hard to navigate, or you can try and use more graphical tools, which offer you filtering and a means to graphically explore the contents of the heap at the point when you took the snapshot. Either way, always bear in mind that the performance counters that these are based on are not necessarily representative of what’s going on within your application in real time.
Misconception #4: .NET Doesn’t Leak Memory
In one sense, this statement is literally true, but the there are problems in .NET which have the same symptoms. It’s ultimately a question of definition:
Old Definition
When you used malloc and free to manage memory yourself, a leak was what happened any time that you forgot to do the free part. Basically, you’d allocate some memory, you’d do some work with it, and then you’d forget to release it back to the runtime system.
Or maybe you were dealing with a very large data structure, and you couldn’t work out what the actual root node into that structure was, which made it very hard for you to start freeing things.
Or maybe you called into a library routine which gave you some objects back, and it wasn’t quite clear if it was you or the library that would later free those objects.
In addition, prematurely releasing objects was often fatal. Say you allocated an object, freed it, and then continued to try and use it. If the memory space you were trying to access had since been allocated to a different object, you’d find yourself with two objects of different types competing over the same memory, and that would often cause things to go catastrophically wrong.
New Definition
The good news is that those days are gone2, and that the .NET runtime, which takes care of freeing objects for you, is also ultra-cautious. It works out whether it thinks a particular object is going to be needed while your program runs, and it will only release that object if it can completely guarantee that it is not going to be needed again.
The difficulty with this, of course, is that it’s difficult to have an effective cost model in your head, describing when objects that you allocate are actually going to be freed again, so understanding your own code can pose its own challenges! Moreover, while this managed memory is a boon, it also has opportunities and loopholes which allow objects to live longer than they should.
2Except when you aggressively dispose.
What Makes Things Live Longer?
There are a few things that might cause your objects to live longer than necessary, causing your application to take up much more memory than you think it should:
The Runtime Itself
The type of build you use can have an effect on object persistence. For example, if you choose to do a debug build instead of a release build, you can find that your objects are kept much longer than they really need to be, because the compiler hasn’t been as aggressive in its optimization.
Having a debugger attached can also make things live longer, as your application will be JITed in such a way that the local variables live to the end of the function, making it easier to debug things.
We’ve already seen that the .NET runtime has a number of heuristics for deciding when to collect higher generations, and it turns out that Gen2 objects will not be collected very often. So, should you have an object that accidentally gets promoted into a higher Generation, it can be a long time before that object gets freed, and its memory gets recycled.
Finalizers are another culprit; in order to implement one, the system waits until an object with a finalizer would have been collected, and then saves that object by promoting it. This means that this object will survive until the collection of the next generation, and perhaps longer if the finalizer thread doesn’t get around to processing it in time.
User Interfaces, and How They Behave
Event handlers are a typical example of this – if you subscribe a delegate to an event handler on a long-existing item, say a top-level Windows form, you’re basically adding a reference to both an object and a method on that object (which is essentially what a delegate is). In short, you’re essentially making your object live as long as the top-level form. If you later forget to unsubscribe the object, you’ll find that you’ve introduced a memory leak (in the form of an unnecessarily long-lived object).
There are other examples of this kind of mishap, but they’re not terribly common, so I won’t dwell on them here.
Libraries
You’ll find some libraries will have caches within themselves to improve their performance, but they may not have a very good lifetime policy on those caches. So you might find that you’re unintentionally keeping the last 50 results, or something like that. Even if you don’t call into that library for a long time, the cache is still going to stay live, and all of those objects are still going to be around.
The Compiler
My favorite of all of these problems has to do with the way the compiler translates more modern constructs in C# to run on the CLR 2 infrastructure that the .NET framework provides. Closures and Lambda expressions are a very good example.
Lambda expressions are not represented as objects in themselves at the level of IL in the CLR, but are represented as compiler-generated classes which are used to maintain references to what were the local variables.
|
1 2 3 4 5 6 7 8 9 10 11 12 |
class Program { private static Func<int> s_LongLived; static void Main(string[] args) { var x = 20; var y = new int[20200]; Func<int> getSum = () => x + y.Length; Func<int> getFirst = () => x; s_LongLived = getFirst; } } |
Listing 3 – Illustrating compiler translation with a lambda expression.
In this simple example, we have two local variables which are referenced by a lambda expression, which itself lives for a very long time by being put in a static field. Now, in order to make the lifetime of these local variables match the lifetime of the lambda function, the C# compiler actually generates all this by wrapping the local variables into a class, of which it makes an instance, and the compiler then represents the lambda functions as delegates on that class.
So in the case of this example, even though the local variable Y doesn’t need to live for a long time (because the lambda expression only refers to the variable X), we’ll find that, due to the way the C# compiler behaves, this large array will live for a very long time.
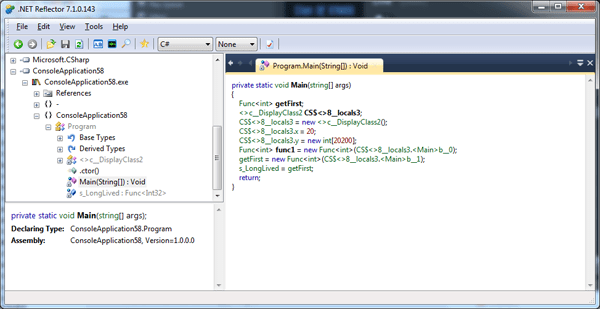
Figure 13 – Using .NET Reflector to see how the C# compiler unintentionally keeps objects alive unnecessarily.
If we look in .NET Reflector to see how that code is generated, we see the compiler has generated this extra display class (see Figure 13, above), and the local variables are actually represented as fields within that display class. However, there is no effort to clear out those fields, even when the system knows that their values can’t be accessed in the future.
Misconception #5: All Objects are Created Equal
Finally, as we saw hints of in Misconception #2, it’s a bad idea to use the copy-&-promote strategy we saw earlier for very large objects, because it takes a very long time (and is very expensive) to copy those objects around. So the designers of the .NET memory management system needed a better way to handle these large objects, and resorted to a standard technique called “mark-and-sweep”. Rather than promoting live objects to another generation, the GC leaves them in place, and keeps a record of the free areas around them, and then uses that record at a later stage to allocate objects. Crucially, there is no compaction at the moment.
No Copying During Collection
Let’s take that simple mutator I wrote earlier, and instead of allocating instances of small objects, we allocate instances of large ones (bear in mind that anything larger than 85k bytes will typically be allocated in the Large Object Heap.) Going through the same scenario as we saw before, we have a series of instances, live and dead, being allocated in cycles:

Figure 14 – Allocating larger objects to the heap
At the point that garbage collection happens, rather than moving these live objects into a new generation, the GC just makes a note of where they are, and then scans through the dead objects, noting their address ranges as free blocks, which it’ll try to use later for allocation requests.

Figure 15 – The post-collection heap, with the free blocks noted by the GC.
Once again, crucially, there is no copying – everything is left in place.
Some Observations
That has some advantages – for starters, there is no movement, so we don’t have to do any fix-ups, and we don’t need to bring other threads to a safe point in order to adjust their pointers. That’s also given us a potential parallelism advantage.
The trouble with this model is that it’s introduced potential fragmentation, and we’ll see in just a moment what fragmentation really means. The GC also now has to make a decision regarding at what point it actually does collections in this Large Object Heap, and it was decided to make this area synonymous with Gen2, at least for GC purposes. This means that whenever a collection of Gen2 occurs, so too does a collection of this Large Object Heap.
The repercussion of that decision is that temporary large objects don’t really fit into this model. For small objects, it was fine to generate things temporarily, as they’d be very quickly and cheaply recycled, but for large objects that’s clearly not the case. So if we generate temporary large objects, it can be a very long time before a Gen2 collection is carried out, and those temporary objects will be holding memory throughout that period.
We also saw that, in order to find the free blocks of memory, the GC has to walk all of the objects on this heap. This behavior is much more expensive from a paging perspective, as we’re actually touching a lot more of the live memory.
The Problem of Fragmentation
This can be illustrated if you have a program that’s allocating objects in a live-dead-live-dead pattern, as seen below.

Figure 16 – An allocation pattern likely to generate a certain degree of fragmentation.
After collection, those dead objects are all marked as free space, ready to be recycled:

Figure 17 – Post-collection memory, now fragmented.
The problem occurs when you try to allocate an object that’s actually slightly bigger than any of these free blocks…

Figure 18 – A hypothetical object, larger than any of the available free slots.
Obviously, the GC finds that this new object won’t fit into any of these free areas. So, even though there is enough free memory available to satisfy the request for an object of that size, the GC will find it doesn’t actually have anywhere to put the new object, and will be forced to resize the LOH to make allocation possible:

Conclusion
We’ve looked at 5 different issues you might have with your .NET memory management, and tried to tell you a little bit of the story and history behind each of them. I think the conclusion is really that there’s a lot going on inside the heap of your process, and ideally you need to be able to visualize what’s going on to be able to understand why things are being kept alive longer than you think.



Load comments