I’ve now experienced three occasions in which I’ve been asked to help to fix a rather mysterious problem with a production Microsoft SQL Server database that was suffering from incidents of performance degradation. The problem was mysterious because it wasn’t caused by one of the typical reasons such as Parameter Sniffing or outdated statistics. In these three incidents, it turned out that the problem of performance degradation was due to transactions being held open unnecessarily when the database was running in READ COMMITTED SNAPSHOT ISOLATION (RCSI) mode.
What is RCSI
The problem that every database developer must deal with is the handling of concurrency: of ensuring that the many tasks in a Microsoft SQL Server instance do not impede each other. A database in Microsoft SQL Server can handle thousands of simultaneous requests for selecting data and doing data modifications. For the protection of this data, Microsoft SQL Server is using locks to arbitrate the requests for the requested resources. This is especially important where data is changed by one process while it is being read by another. When, for example, a user is editing a product stock level in a warehouse management system, then Microsoft SQL Server must make sure that nobody can read this record at the same time: otherwise the stock level could be out-of-date. Figure 1 illustrates this concept.
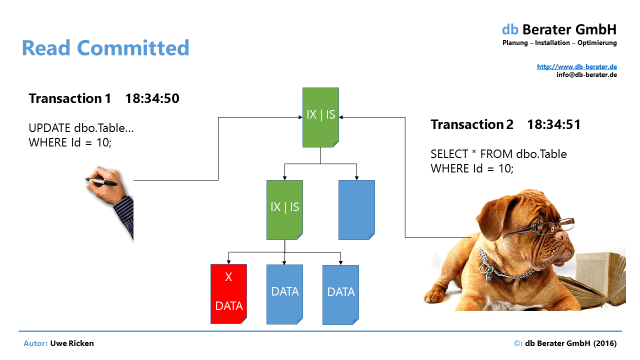
Figure 1: Protecting the record while it gets changed
Transaction 1 (T1) is changing the record with ID = 10 while Transaction 2 (T2) is trying to read the same record. T1 is using an exclusive lock on the resource to avoid access from T2, which wants to read the uncommitted record data. This behavior is called pessimistic locking and is the expected behavior of Microsoft SQL Server in the default read committed transaction isolation level. As a workaround, Microsoft introduced for the first time, with Microsoft SQL Server 2005, the READ COMMITTED SNAPSHOT ISOLATION (RCSI) level. The word ‘snapshot’ describes the workaround that allows other requests to read data even if it is locked exclusively.
The other processes access a copy of the locked data which is stored in the Version Store within TEMPDB. The copied data is called a version_ghost_record and can be monitored by querying the system view [sys].[dm_db_index_physical_stats]. The value in version_ghost_record_count returns the number of ghost records retained by an outstanding snapshot isolation transaction in an allocation unit. The copy will be created before T1 starts changing data. The copy represents a valid record as it was before the transaction started as shown in Figure 2.
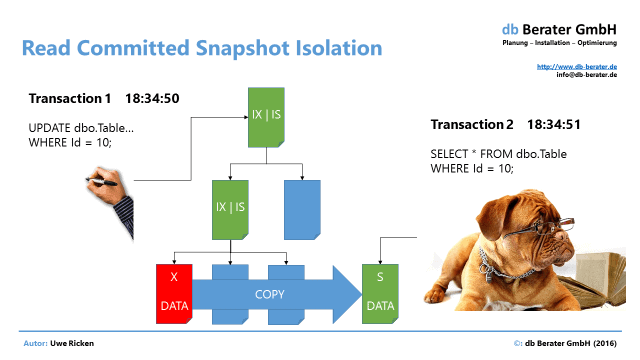
Figure 2: Move a copy of the locked record into the version store in TEMPDB
Many developers are now using RCSI to avoid deadlock situations and long waits for a blocked resource. These problems are generally caused by either implicit or explicit transactions being held open for too long for the workload. Unfortunately, RCSI can be a bad choice for an isolation mechanism in these very circumstances. The following example will demonstrate the strange consequences of using RCSI to fix a locking/blocking problem that I’ve seen now for the third time in an application.
Test Environment
All systems where the problem occurred were using a similar workload. The applications were using small tables for storing new status records and deleting outdated status records. The content of these ‘rotating data’ tables is used for tracking the flow of work. I’ll use an example from the automotive industry. When a product needs to be assembled on a succession of different workbenches, it will be transported with a conveyor belt to the different operating steps. When the carrier passes a measure point, a new record will be inserted into the table. When the assembly process is finished, it moves to the next workbench and the record is deleted. The following test scenario will simulate this type of workflow as shown in Figure 3.
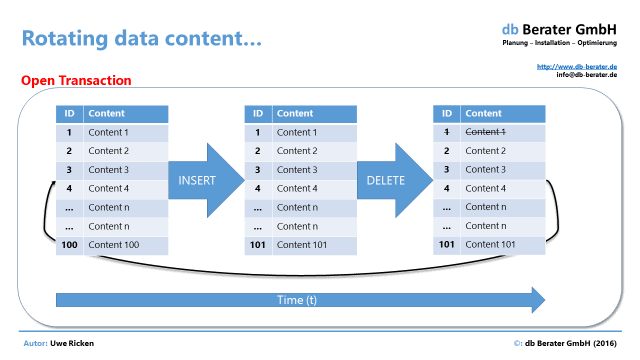
Figure 3: Rotating data content in a status table
The picture shows the single steps of the workload. In a starting stock of records (~1,000 records) a process will insert new records and will then delete the old records from the table.
Activating RCSI for the demo database
When a new database is created, RCSI is not activated by default. It must be enabled, and the activation needs to have exclusive access to the database.
|
1 2 3 4 5 6 |
USE Master; GO ALTER DATABASE demo_db SET READ_COMMITTED_SNAPSHOT ON; GO USE demo_db; GO |
Creating a demo table with a few records
When RCSI has been activated, it is time to create the demo table. You can use the following script to quickly insert a few records into the test table,
|
1 2 3 4 5 6 7 8 9 10 11 12 13 14 15 16 17 |
CREATE TABLE dbo.demo_table ( ID INT NOT NULL IDENTITY (1, 1), C1 CHAR(100) NOT NULL ); GO INSERT INTO dbo.demo_table (C1) SELECT TOP (1000) CAST(TEXT AS CHAR(100)) AS C1 FROM sys.messages WHERE language_id = 1031; GO CREATE UNIQUE CLUSTERED INDEX cuix_demo_table_Id ON dbo.demo_table (Id); GO |
You can check the efficient access pattern with the following query It will show an INDEX SCAN which uses 2 I/Os. Don’t worry about the SCAN; the query is using a TOP operator to limit the output to one (last) record.
|
1 2 3 |
SET STATISTICS IO ON; GO SELECT MAX(Id) FROM dbo.demo_table; |
Figure 4 shows the plan.
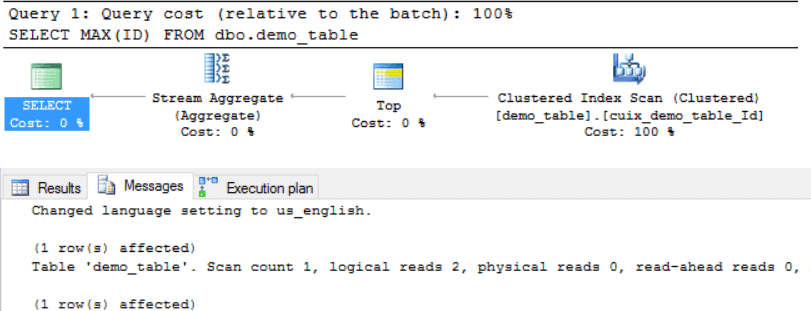
Figure 4: Efficient data access by usage of an index
Both the number of data pages that are used and the number of records are easily understandable, and so, the experiment can start.
Prerequisites
Before the workload starts, a few prerequisites are required to measure the increasing value of version_ghost_records while the transaction is up and running. You can use different approaches to fulfill this requirement:
- Create your own routine within the running transaction which saves each n seconds the number value in a temporary table
- Monitor the increasing value with PERFMON
- Use a professional monitoring tools like Redgate SQL Monitor®
In this demo I’ll use PERFMON to track the number of version records in the table. SQL Server has not implemented counters for this requirement, so you have to define your own counters for PERFMON.
User Settable Objects
Microsoft SQL Server provides a User Settable object which allows you to create custom counter instances. Custom counter instances can be used to monitor aspects of the server not monitored by existing counters, such as components unique to your SQL Server database.
The User Settable object contains 10 instances of the query counter: User counter 1 through User counter 10. These counters map to the SQL Server stored procedures sp_user_counter1 through sp_user_counter10. As these stored procedures are executed by user applications, the values set by the stored procedures are displayed in System Monitor.
Note: The user counters are not polled automatically by Performance Monitor. They must be explicitly executed by a user application for the counter values to be updated (e.g. a SQL Server Agent Job)!
User Settable Counter for version_ghost_record_count
The basic information about the number of [version_ghost_record_count] is in the system function [sys].[dm_db_index_physical_stats]. Unfortunately, this DMF has to run in DETAILED modus. This means that Microsoft SQL Server has to go through ALL allocated pages of the index to evaluate the required information!
|
1 2 3 4 5 6 7 8 9 10 |
SELECT version_ghost_record_count FROM sys.dm_db_index_physical_stats ( DB_ID(), OBJECT_ID(N'dbo.demo_table', N'U'), 1, NULL, N'DETAILED' ) WHERE index_level = 0 |
To bind this information to a User Settable Object it needs to be stored in a variable which then will be pushed to the PERFMON application.
|
1 2 3 4 5 6 7 8 9 10 11 12 13 14 15 16 |
-- Add a user definied counter for the monitoring in PERFMON DECLARE @cache_size BIGINT; SET @cache_size = ( SELECT version_ghost_record_count FROM sys.dm_db_index_physical_stats ( DB_ID(), OBJECT_ID(N'dbo.demo_table', N'U'), 1, NULL, N'DETAILED' ) WHERE index_level = 0 ); EXEC sp_user_counter1 @cache_size; |
SQL Server Agent Job for Population of Counter Value
Due to the requirement that PERFMON cannot actively pull the information from SQL Server an application process must provide the data. Here a SQL Server Agent job which runs every 10 seconds will help to populate the number of version_ghost_records. Figures 5, 6, and 7 show the job properties.
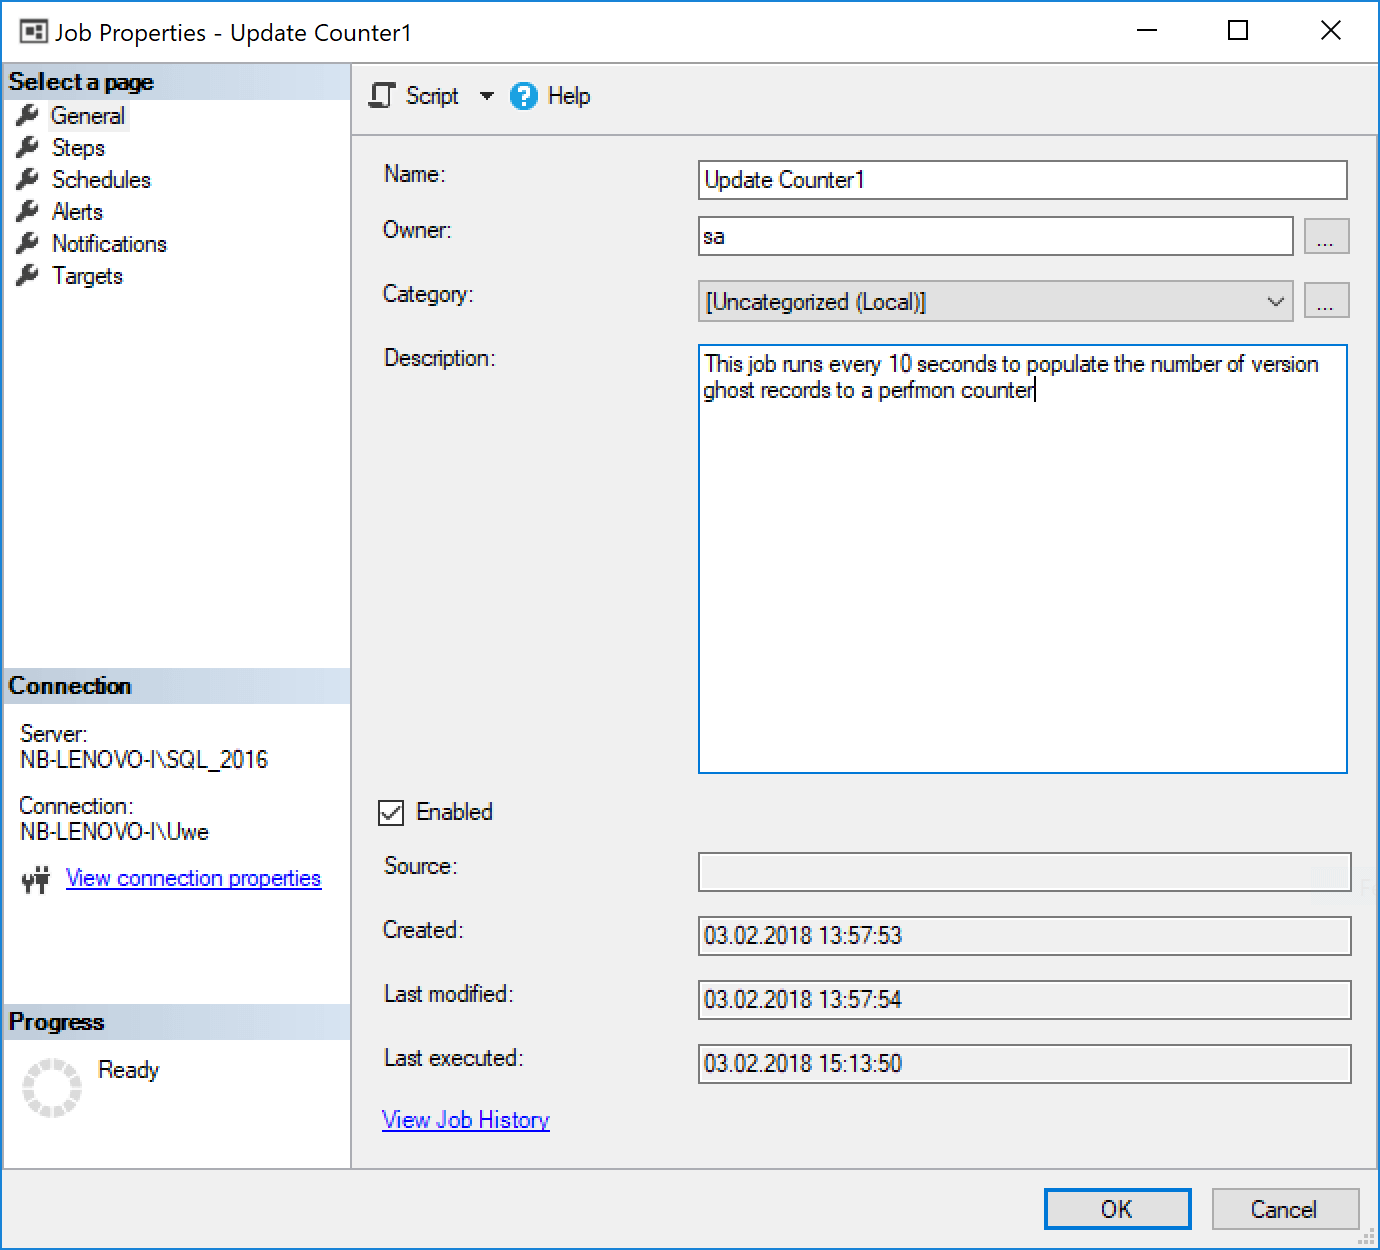
Figure 5: Create a SQL Server Agent Job for population of the counter value
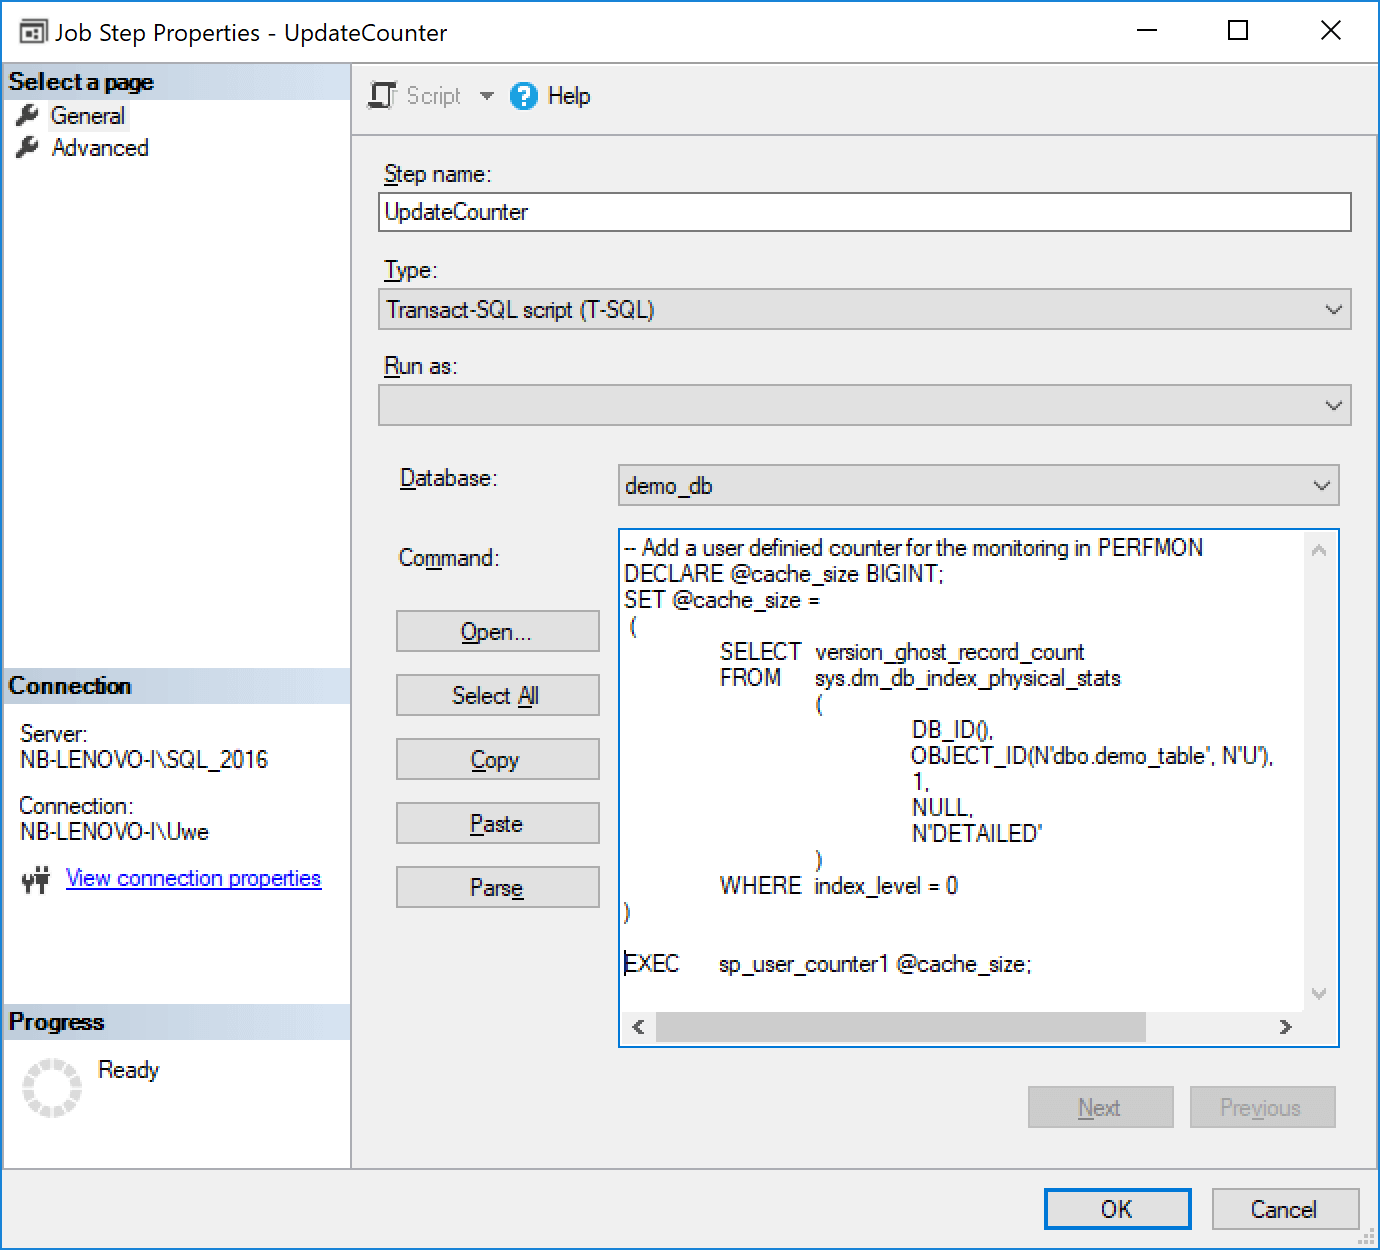
Figure 6: The job executes a query against sys.dm_db_index_physical_stats
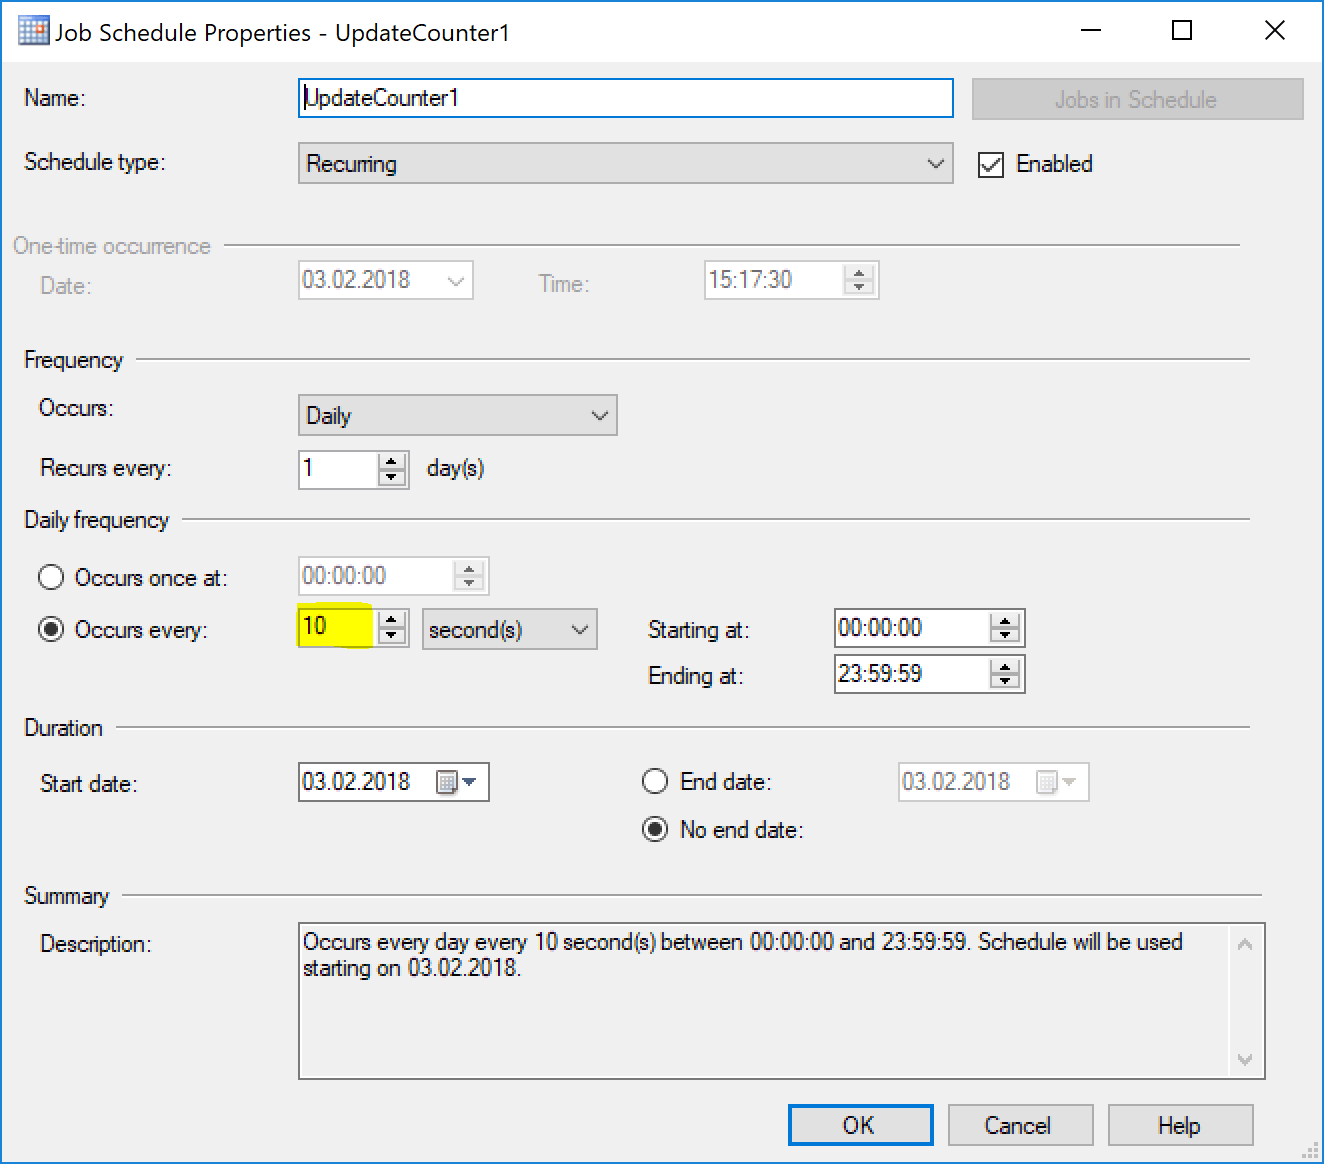
Figure 7: The scheduler will update the counter value every 10 seconds
Setup PERFMON
To monitor the increasing value of version ghost records the next step is the preparation of PERFMON to show the development of version ghost records in a graph. Therefore, the User Settable counter must be added to the main Performance Monitor graph.
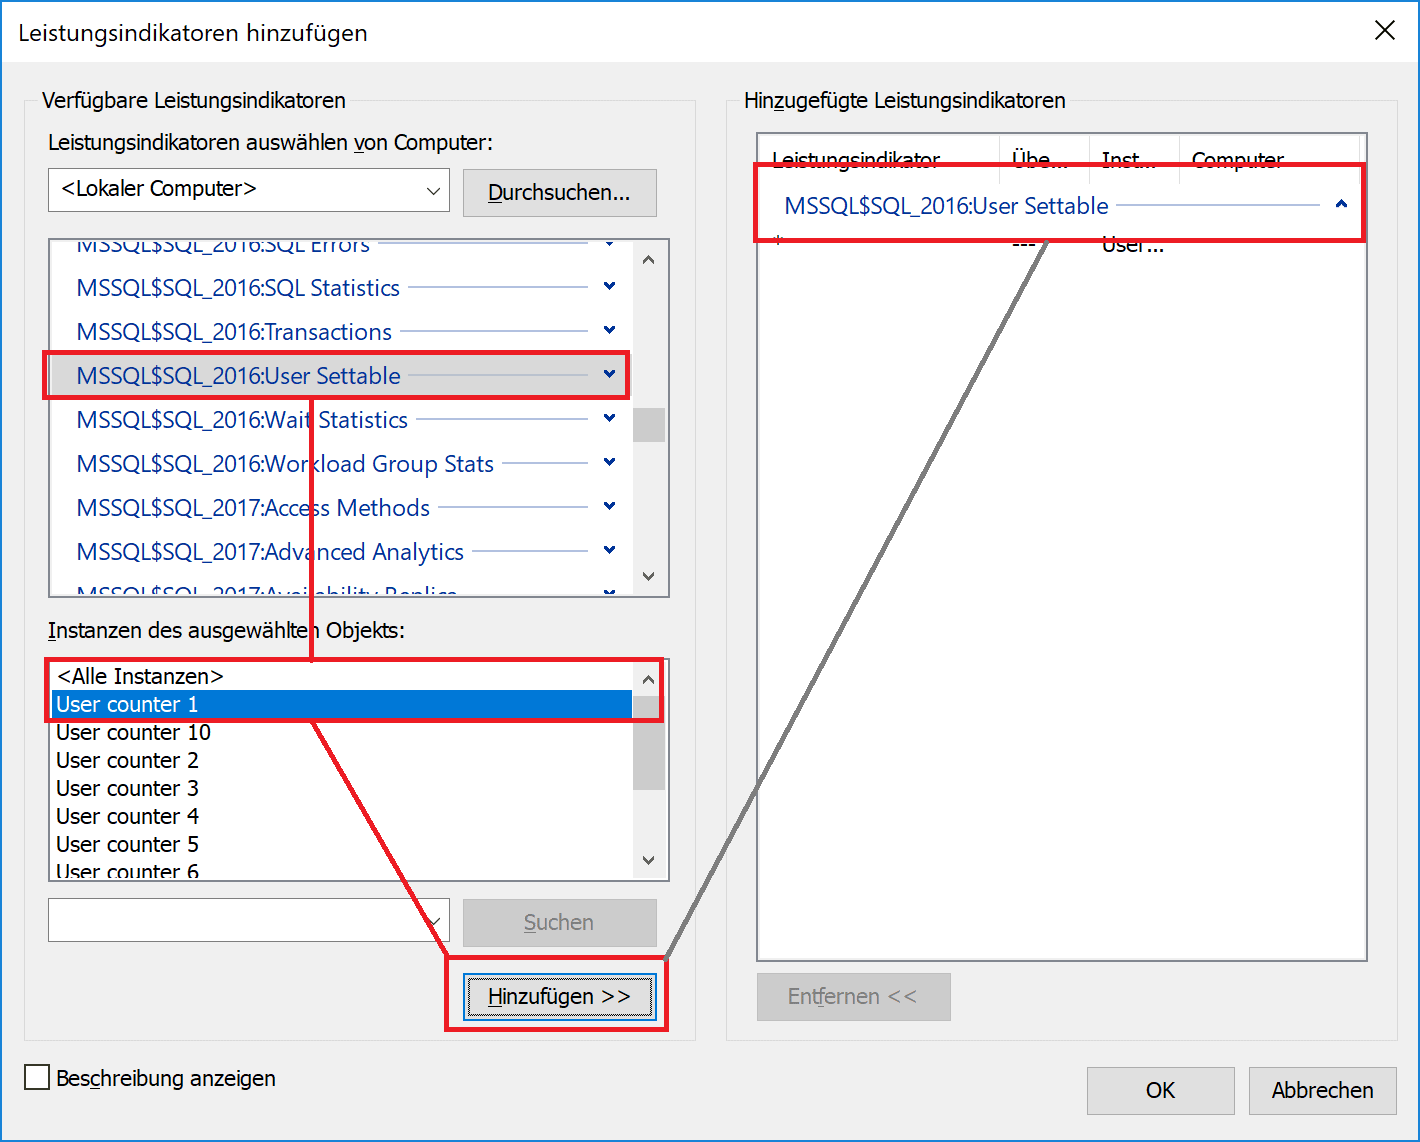
Figure 8: Add the user counter for monitoring
Starting the workload
The next script will start and simulates the workload that I’ve suggested as an example. Please note that an explicit transaction is opened, and then it starts a continuous loop in which it will first insert a new record at the end of the table. After waiting for 10ms, it then deletes the oldest record from the table. The special feature is that open transaction. It never gets closed! That was exactly the problem in all 3 observed scenarios!
|
1 2 3 4 5 6 7 8 9 10 11 12 13 14 15 16 17 18 19 20 21 22 23 |
-- We start our workload SET NOCOUNT ON; GO BEGIN TRANSACTION; GO -- Insert new record into dbo.demo_table DECLARE @finish_date DATETIME2(0) = DATEADD(MINUTE, 5, GETDATE()); WHILE @finish_date >= GETDATE() BEGIN -- wait 10 ms before each new process INSERT INTO dbo.demo_table(C1) SELECT C1 FROM dbo.demo_table WHERE Id = (SELECT MIN(Id) FROM dbo.demo_table); -- Wait 10 ms to delete the first record from the table WAITFOR DELAY '00:00:00:010'; -- Now select the min record from the table DELETE dbo.demo_table WHERE Id = (SELECT MIN(Id) FROM dbo.demo_table); END ROLLBACK TRAN; GO |
The above workload creates a rotating system. The workload is running for five minutes in my demo. While it is running I reproduce, in a different query window and process, the SELECT-statements. I do these in two different ways. The first statement is using RCSI while the second query is reading data with READ UNCOMMITTED isolation level.
|
1 2 3 4 5 6 7 8 9 10 11 12 |
SET STATISTICS IO ON; SET NOCOUNT ON; GO PRINT 'I/O with RCSI...' SELECT MAX(ID) FROM dbo.demo_table; GO PRINT 'I/O with READ UNCOMMITTED...' SELECT MAX(ID) FROM dbo.demo_table WITH (NOLOCK); GO SET STATISTICS IO OFF; GO |
Figure 9 shows the logical reads of the two statements.

Figure 9: Different IO with READ COMMITTED SNAPSHOT ISOLATION
Analysis of the workload
The first output will show a max value of 1,000 (the value before the transaction started) while the second one will show a much higher max value (from the uncommitted data). Furthermore, the simple aggregation query produces 164 page reads while the second query only read 2 data pages! Within five minutes of tests the number of allocated data pages have changed dramatically.
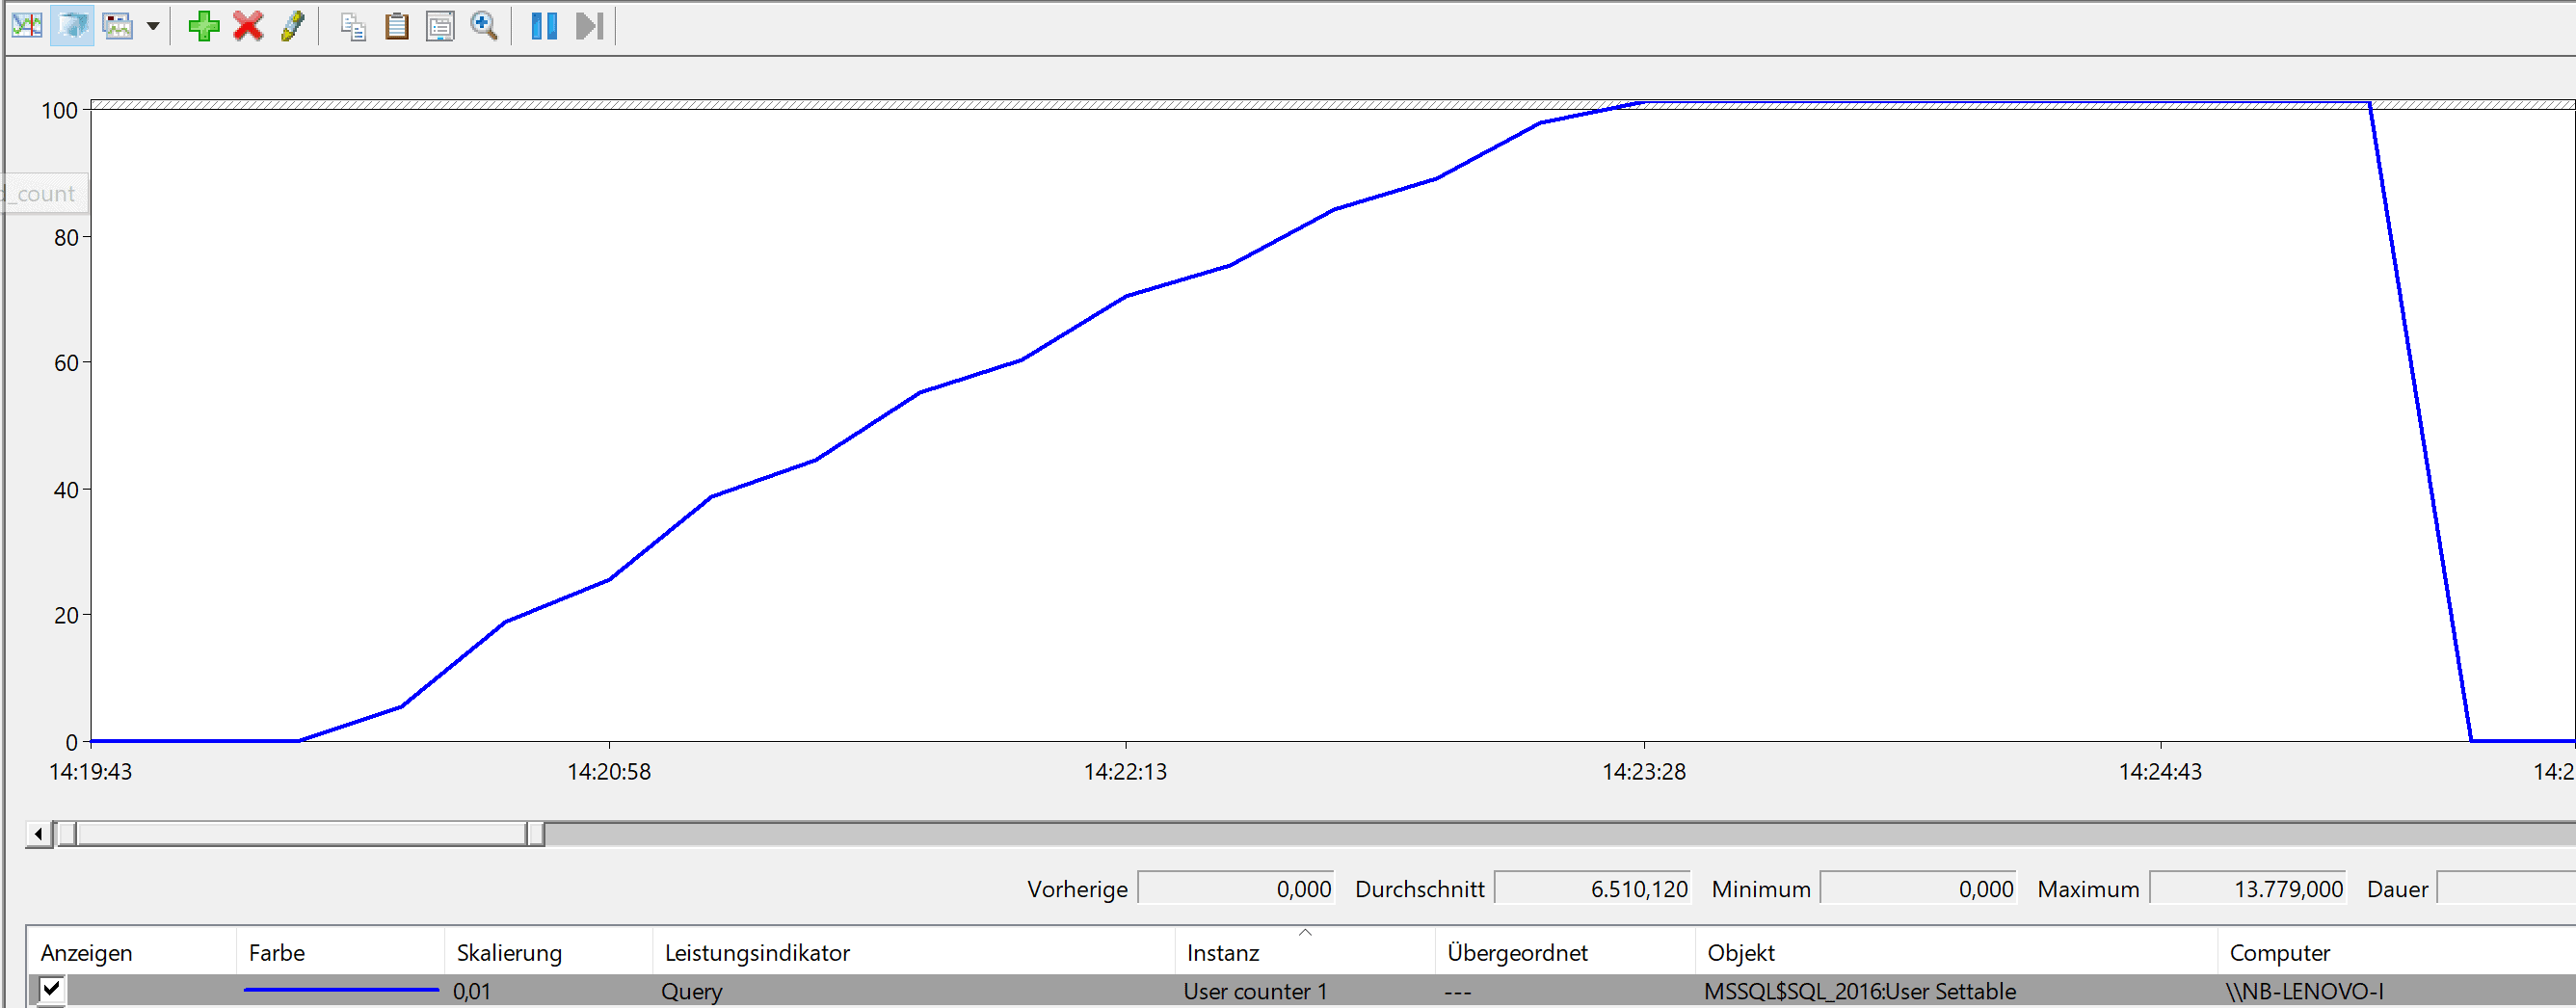
Figure 10: Number of version_ghost_record_count which have been produces in 5 minutes
The screenshot demonstrates the quick rise of ghost versioned records in the affected table over the period of five minutes. The maximum number of ghost versioned records in this example were ~14,000 rows; one of the affected systems was running in an open transaction for more than three months!
The Reason for this Behavior
The reason for this strange behavior is quick and easy to explain. The workload for a ‘rotating system’ is permanently creating new records that are used within the open transaction. The aggregation function must consider every single change in the version store to return a valid value.
The second query is running in READ UNCOMMITTED isolation level and will not use RCSI (which is only usable in READ COMMITTED isolation level) and will use dirty reads.
Solution for this Problem
In all the three incidents of this problem that I’ve looked at, the bug was not in Microsoft SQL Server but in the development of the implemented workload. Because the transaction has been started explicitly, it stood open for the whole time. The version store cannot be cleared out, and the number of ‘copies’ of the data are increasing.
As a developer, you must make sure that explicit transactions will be short and will be closed immediately after the process is finished. At the point when the transaction is committed / closed, all data pages from the version store will be released immediately, and the performance degradation disappears.
Advice
It is good to set up a permanent way of monitoring the number of version_ghost_records in a database, especially if RCSI for a database is activated. A high count for these records is just the sort of stress condition to be alerted about, because it indicates a potential slow-down in database performance due to the version store in TEMPDB getting too large, and causing queries against the table to suffer from performance degradation. You might think PERFMON is way too complex for handling and implementation of such a solution? If you want to store and analyze the evolution of counters over longer periods it might be useful to use professional tools like Redgate SQL Monitor for these observations. To learn how to add an alert to SQL Monitor for this issue, check out this article.


Load comments