How to record T-SQL execution times using a SQL Prompt snippet
Phil Factor shares a SQL Prompt snippet called timings, which he uses as a standard testbed for getting execution times for procedures and functions.
A SQL Prompt snippet is a pre-defined block of code, which we can insert at the current cursor position, or around currently-selected SQL text, in an SSMS query pane. DBAs use them to store all their most commonly-used checks and routines. It’s often useful to have your favorite troubleshooting scripts available to you within a few keystrokes, especially when firefighting an urgent issue, with people staring over your shoulder.
A developer like me uses them to try to aim for a better quality of code in the same amount of time. In this quick tip, I share the SQL Prompt snippet I use as a standard testbed for getting execution times for procedures and functions.
Doing T-SQL Code Timings
During development work, I might have two functions that perform the same task in different ways, and want to compare their performance. I need timings under different workloads so I can ensure the functions work at scale. I need to record all timings, so if I change a function, I can see if there is an improvement or regression.
For example, Listing 1 calls two functions that shred a JSON document into a SQL hierarchy table, JSONHierachy and ParseJSON, and then two, JSONVersion and ToJSON, which create JSON documents from a hierarchy table. I’m not going to show the full routines here because it’s a lot of code, and all these routines are published on Simple-Talk, in my series about JSON and SQL Server.
|
1 2 3 4 5 6 7 8 9 10 11 12 13 14 15 |
-- call JSONHierarchy function DECLARE @theHierarchy hierarchy, @BucketHierarchy hierarchy, @bucket nvarchar(MAX) INSERT INTO @theHierarchy(Element_ID, SequenceNo, Parent_ID, Object_ID, NAME, StringValue, ValueType) SELECT Element_ID, SequenceNo, Parent_ID, Object_ID, NAME, StringValue, ValueType FROM dbo.JSONHierarchy(@JSONData, DEFAULT, DEFAULT, DEFAULT) -- call ParseJSON function INSERT INTO @BucketHierarchy(Element_ID, SequenceNo, Parent_ID, Object_ID, NAME, StringValue, ValueType) SELECT Element_ID, SequenceNo, Parent_ID, Object_ID, NAME, StringValue, ValueType FROM dbo.ParseJSON(@JSONData) --call JSONVersion SELECT @bucket = dbo.JSONVersion(@theHierarchy, DEFAULT, DEFAULT) --Call ToJson SELECT @bucket = dbo.ToJSON(@theHierarchy) |
Listing 1
I want to compare the performance of each of these functions, and I want to store the results in a table so I can query them easily. How do I do it?
One way might be to use SET STATSTICS TIME. Once set to ON, SQL Server records millisecond timings for execution of every subsequent query or routine in the batch, until we issue SET STATSTICS TIME OFF. It’s a rather indiscriminate approach and often I don’t want to measure everything, only specific bits. In this case, I could use a simple ssit snippet, which puts SET STATSTICS TIME ON before each function and SET STATSTICS TIME OFF afterwards, and it would need a print statement to be certain what was being measured.
However, it still isn’t easy to associate the time with the part of the batch that was executed; I’d need to cut and paste the results. Also, there is a suspicion that the SET STATSTICS TIME ON could even affect the timings. I want more precision, and I want to save timings to a table.
The SQL Prompt Timings snippet
Listing 2 shows my timings snippet, which I can use and adapt to get the timings for specific parts of any routine.
|
1 2 3 4 5 6 7 8 9 10 11 12 13 14 15 16 17 18 19 20 |
DECLARE @log table ( TheOrder int IDENTITY(1, 1), WhatHappened varchar(200), WHENItDid datetime2 DEFAULT GETDATE() ) ----start of timing INSERT INTO @log(WhatHappened) SELECT 'Starting $routine$' --place at the start $SELECTEDTEXT$$CURSOR$ --where the routine you want to time ends INSERT INTO @log(WhatHappened) SELECT '$routine$ took ' SELECT ending.WhatHappened, DATEDIFF(ms, starting.WHENItDid, ending.WHENItDid) FROM @log starting INNER JOIN @log ending ON ending.TheOrder = starting.TheOrder + 1 --list out all the timings |
Listing 2
In an SSMS query window, highlight the code in Listing 2 and, from the right-click context menu, select Create Snippet. Give it a name (I called mine timings) and a description and save it.
Next, select the original routine calls in Listing 1 and evoke the snippet from the Action list.
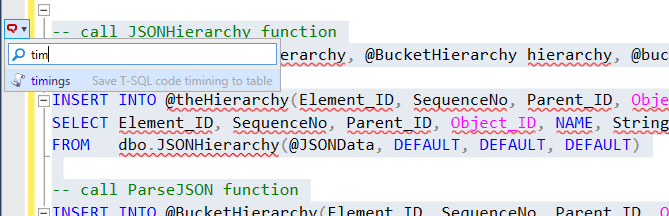
Figure 1
SQL Prompt will inject the selected code into the timings snippet, as shown in Figure 2. I’ve filled in the value for the $routine$ placeholder.
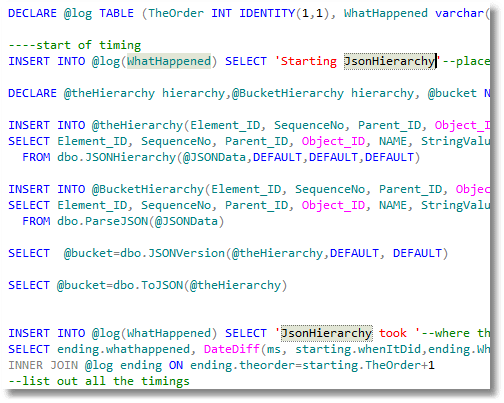
Figure 2
From there, with a quick bit of cut-and-paste, I extend it to record separate timings for each of the sections I want to measure (see the where <routine> ends comments in the code).
|
1 2 3 4 5 6 7 8 9 10 11 12 13 14 15 16 17 18 19 20 21 22 23 24 25 26 27 28 29 30 31 32 33 34 35 36 37 38 39 40 41 42 43 44 45 46 47 |
DECLARE @log table ( TheOrder int IDENTITY(1, 1), WhatHappened varchar(200), WHENItDid datetime2 DEFAULT GETDATE() ) ----start of timing INSERT INTO @log(WhatHappened) SELECT 'Starting JSONHierarchy' --place at the start -- call JSONHierarchy function DECLARE @theHierarchy hierarchy, @BucketHierarchy hierarchy, @bucket nvarchar(MAX) INSERT INTO @theHierarchy(Element_ID, SequenceNo, Parent_ID, Object_ID, NAME, StringValue, ValueType) SELECT Element_ID, SequenceNo, Parent_ID, Object_ID, NAME, StringValue, ValueType FROM dbo.JSONHierarchy(@JSONData, DEFAULT, DEFAULT, DEFAULT) INSERT INTO @log(WhatHappened) --where JSONHierarchy ends SELECT 'JSONHierarchy' -- call ParseJSON function INSERT INTO @BucketHierarchy(Element_ID, SequenceNo, Parent_ID, Object_ID, NAME, StringValue, ValueType) SELECT Element_ID, SequenceNo, Parent_ID, Object_ID, NAME, StringValue, ValueType FROM dbo.ParseJSON(@JSONData) INSERT INTO @log(WhatHappened) --where ParseJSON ends SELECT 'ParseJSON' --call JSONVersion SELECT @bucket = dbo.JSONVersion(@theHierarchy, DEFAULT, DEFAULT) INSERT INTO @log(WhatHappened) --where JSONVersion ends SELECT 'JSONVersion' --Call ToJSON SELECT @bucket = dbo.ToJSON(@theHierarchy) INSERT INTO @log(WhatHappened) --where ToJSON ends SELECT 'ToJSON' SELECT ending.WhatHappened, DATEDIFF(ms, starting.WHENItDid, ending.WHENItDid) FROM @log starting INNER JOIN @log ending ON ending.TheOrder = starting.TheOrder + 1 --list out all the timings |
Listing 3
Figure 2 shows the results, with timing in milliseconds for each step in the batch.
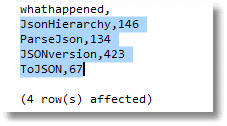
Figure 2
Hmm, nearly half a second for JSONversion! I don’t like the look of that; clearly, this routine needs a bit more development work!
I can, of course, save the timings into a more permanent log, as part of testing. Often, I will run the sequence of tests with different sizes of data, a longer or shorted JSON document in this case, so it is useful to be able to compare with previous results. I often export the results and plot them in Excel or GnuPlot.
Tools in this post
You may also like
-

Article
How to Test SQL Server Functions and Procedures using SQL Prompt
Phil Factor shows how to create a table of input values versus expected results, and then use it to unit test your SQL stored procedures and functions and verify that they always produce the correct results. He uses SQL Prompt to make this task much simpler.
-
Article
When to use the SELECT…INTO statement (PE003)
SELECT…INTO is a useful shortcut for development work, especially for creating temporary tables. However, it no longer has a clear performance advantage and should be avoided in production code. It is better to use a CREATE TABLE statement, where you can specify constraints and datatypes in advance, making it less likely that inconsistencies will sneak into the data.
-
Article
Insert Statement Without Column List (BP004)
Many production databases have failed embarrassingly as a result of
INSERTcode that omits a column list, usually in mysterious ways and often without generating errors. Phil Factor demonstrates the problem, and advocates a 'defense-in-depth' approach to writing SQL, in order to avoid it. -
Article
SQL Prompt and other Tools now use a Dedicated Entra ID Application for Azure SQL Databases – Update Required
If you use Microsoft Entra ID to connect Redgate tools, such as SQL Prompt, to Azure SQL Databases, please update to the versions listed below before July 31, 2025. These versions use a new, dedicated Entra ID app to authenticate. Earlier versions use an authentication method that will no longer work after July 31st. This
-

Live training session
More Gems from the SQL Prompt Treasure Chest
Join Grant Fritchey, a Redgate Advocate and Owen Standage from the Redgate SQL Prompt development team to see some more of the features you may not be using and become the captain of your SQL Prompt ship. Some of the gems we'll be demonstrating are: Azure Connections, Smart Rename, Split Table, Find invalid objects, Summarise Script, Script as alter, Find unused variables, Column picker.