
Through continuous innovation, Redgate Monitor stays ahead. So you, your team and the whole organization can, too!
Click on a feature to learn more.
2021
2022
2023
2024
The Evolution of Redgate Monitor 2021 to 2024

Azure SQL Managed Instance Support
Monitor your Azure SQL Managed Instances alongside your on-premises and other cloud-based servers, instances, and databases.

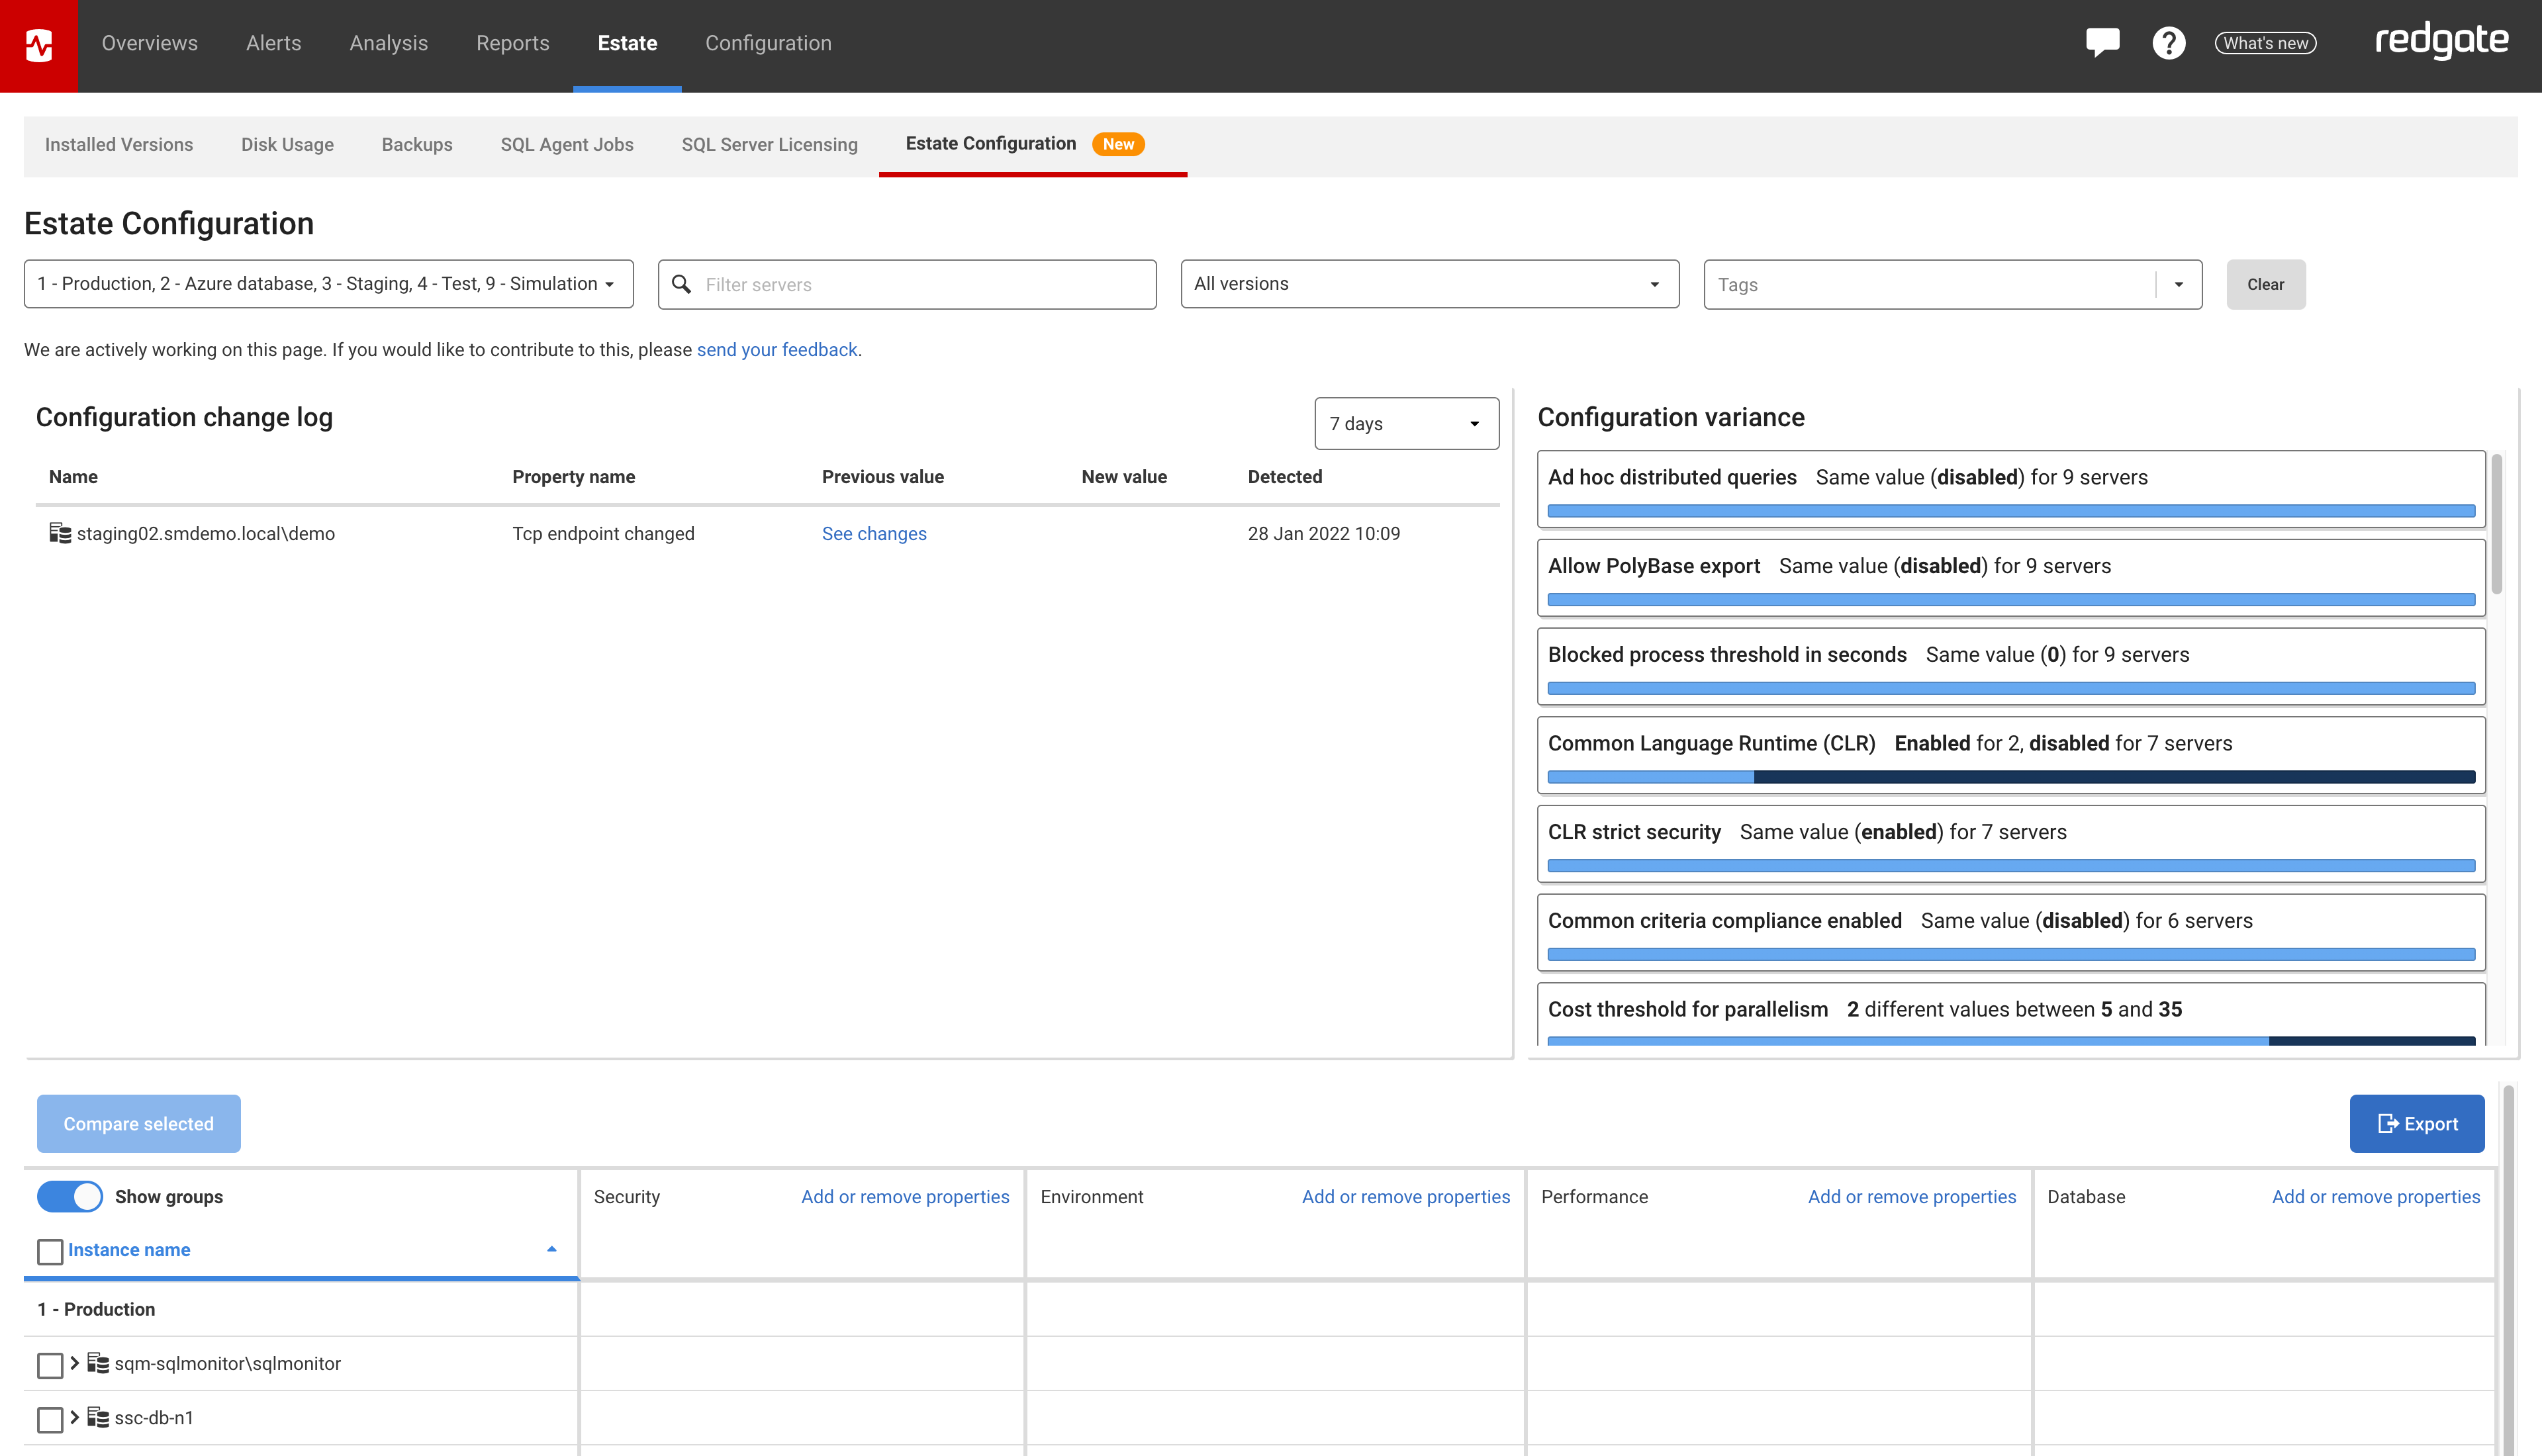
SQL Server configuration information
Detect discrepancies and check for compliance using the overview of key server and database configuration options.

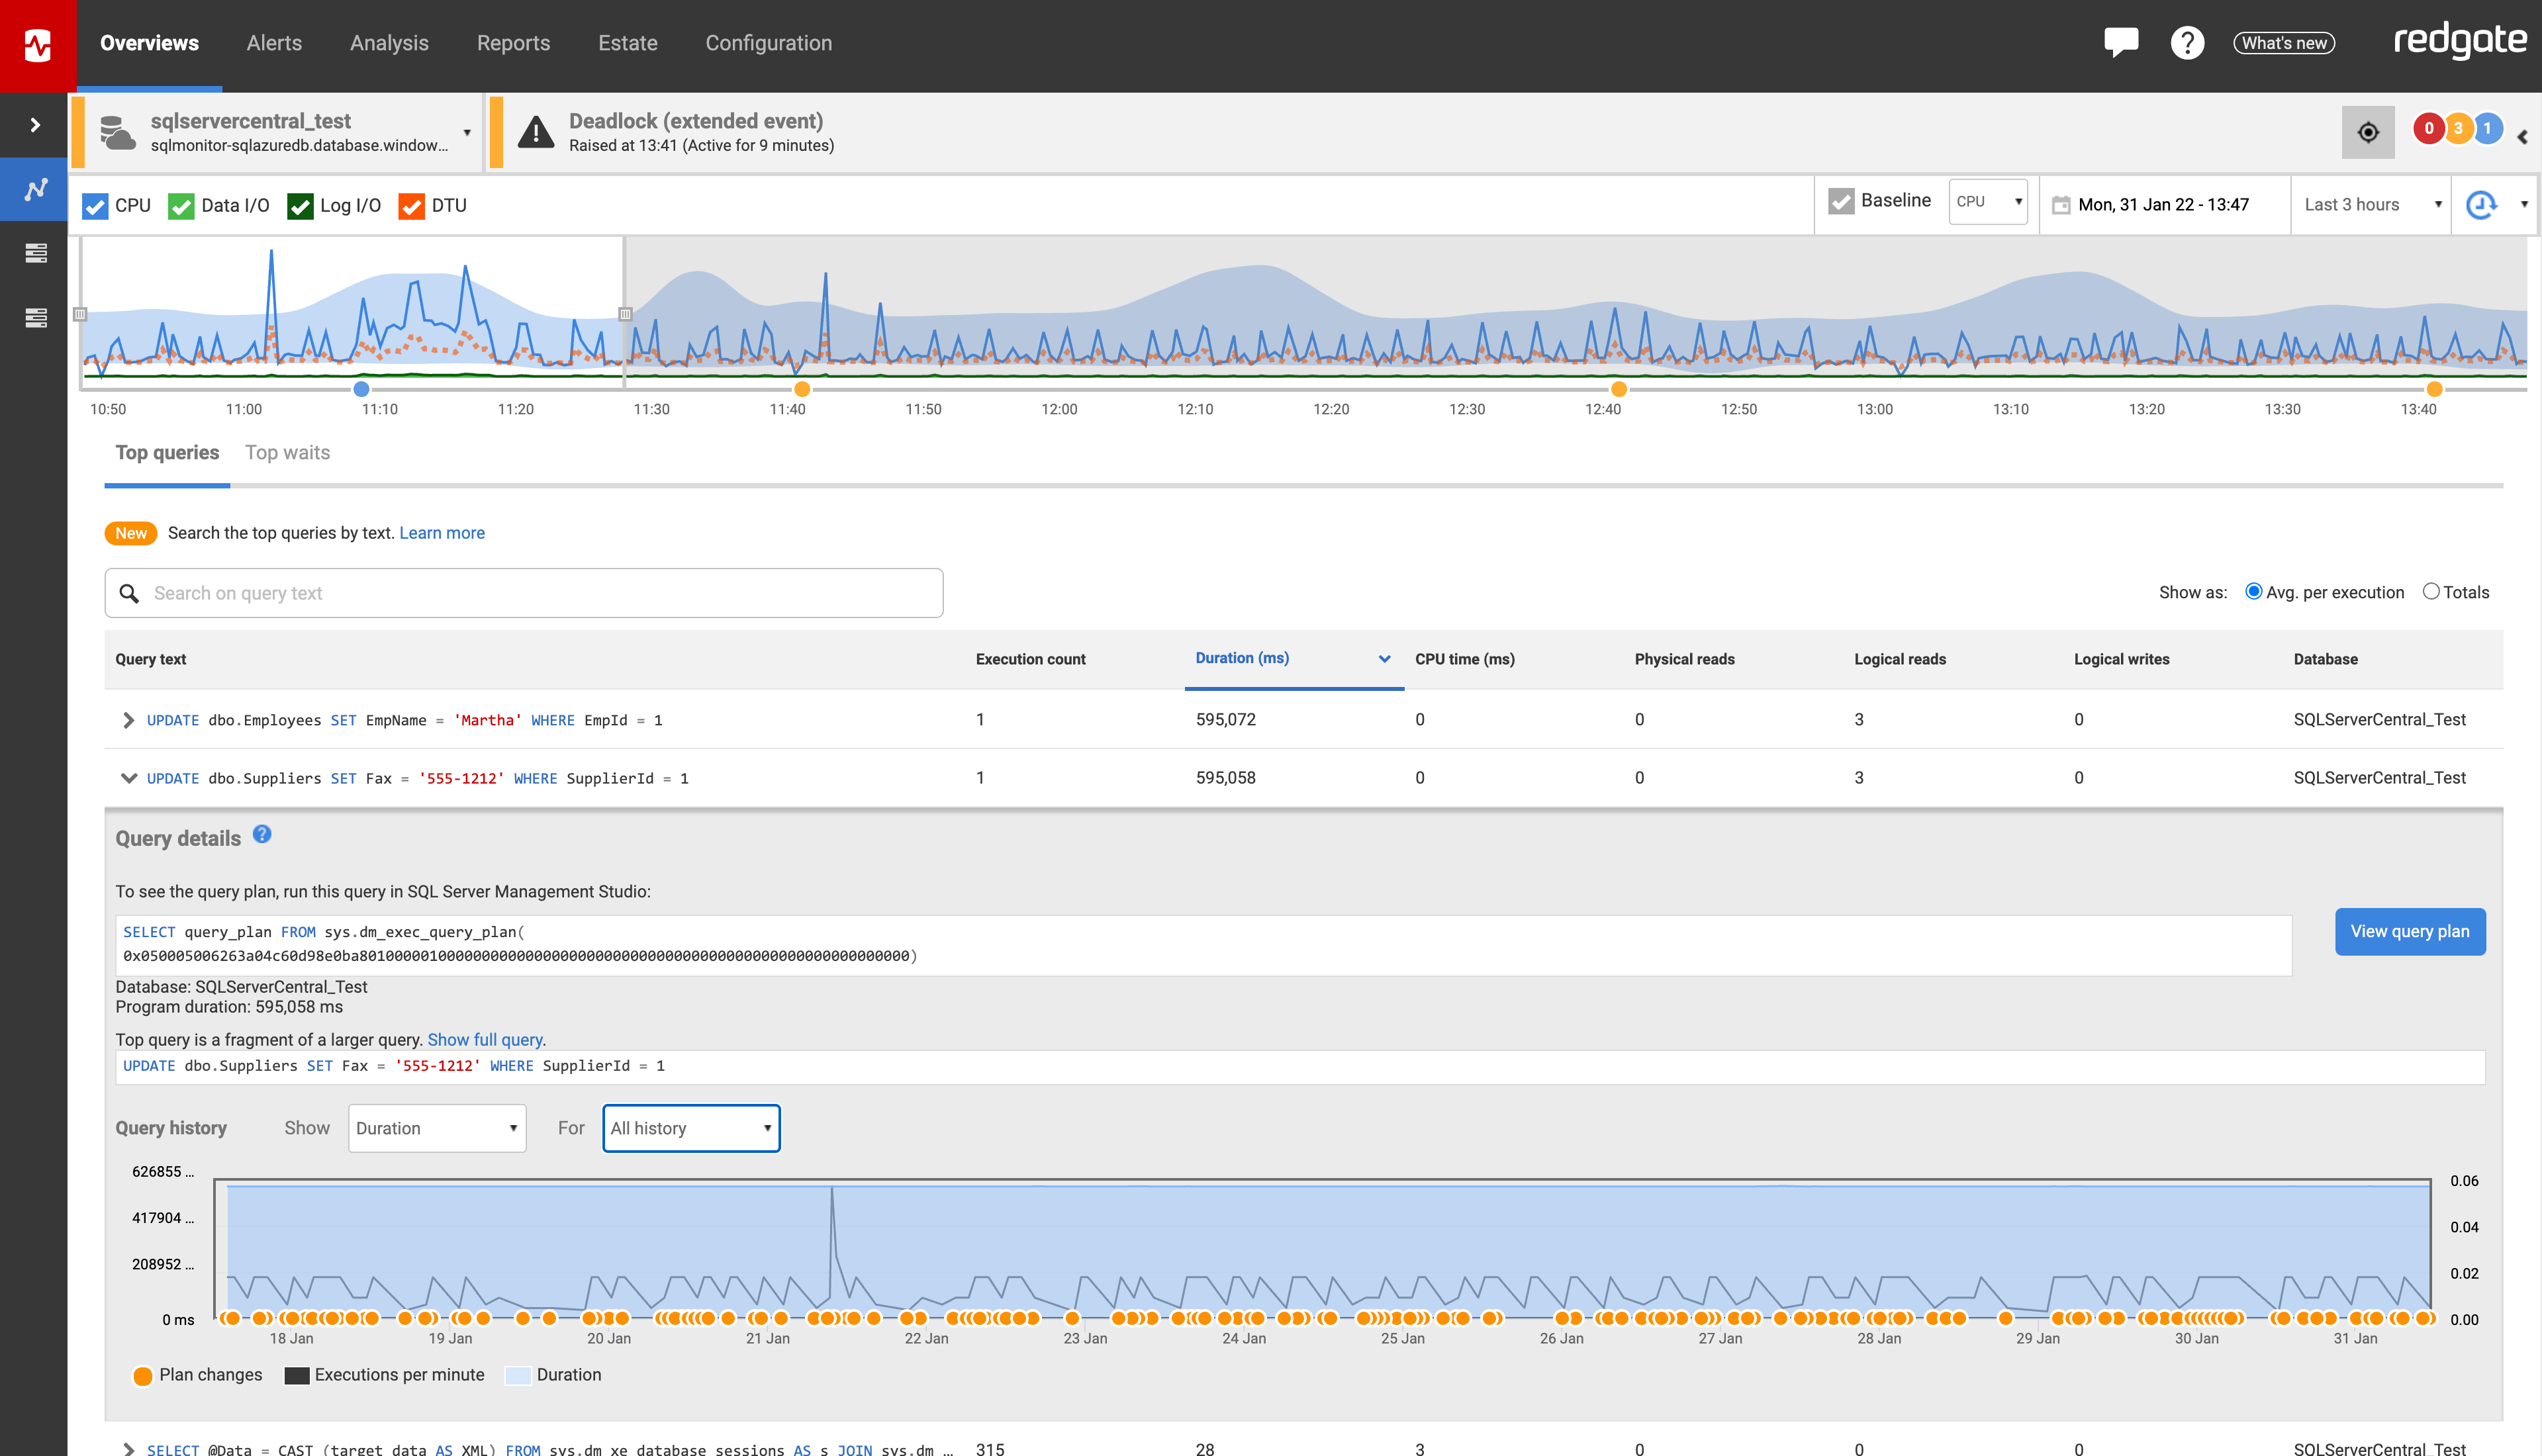
Query search bar
Redgate Monitor now comes with a query search bar that allows you to quickly search and find the query you’re interested in. You can search the top queries sampled by Redgate Monitor and check how a specific query is performing.

Migration onto ASP.NET Core
Rely on the future viability of Redgate Monitor, which with migration to .NET Core performs even better and speeds up future developments.

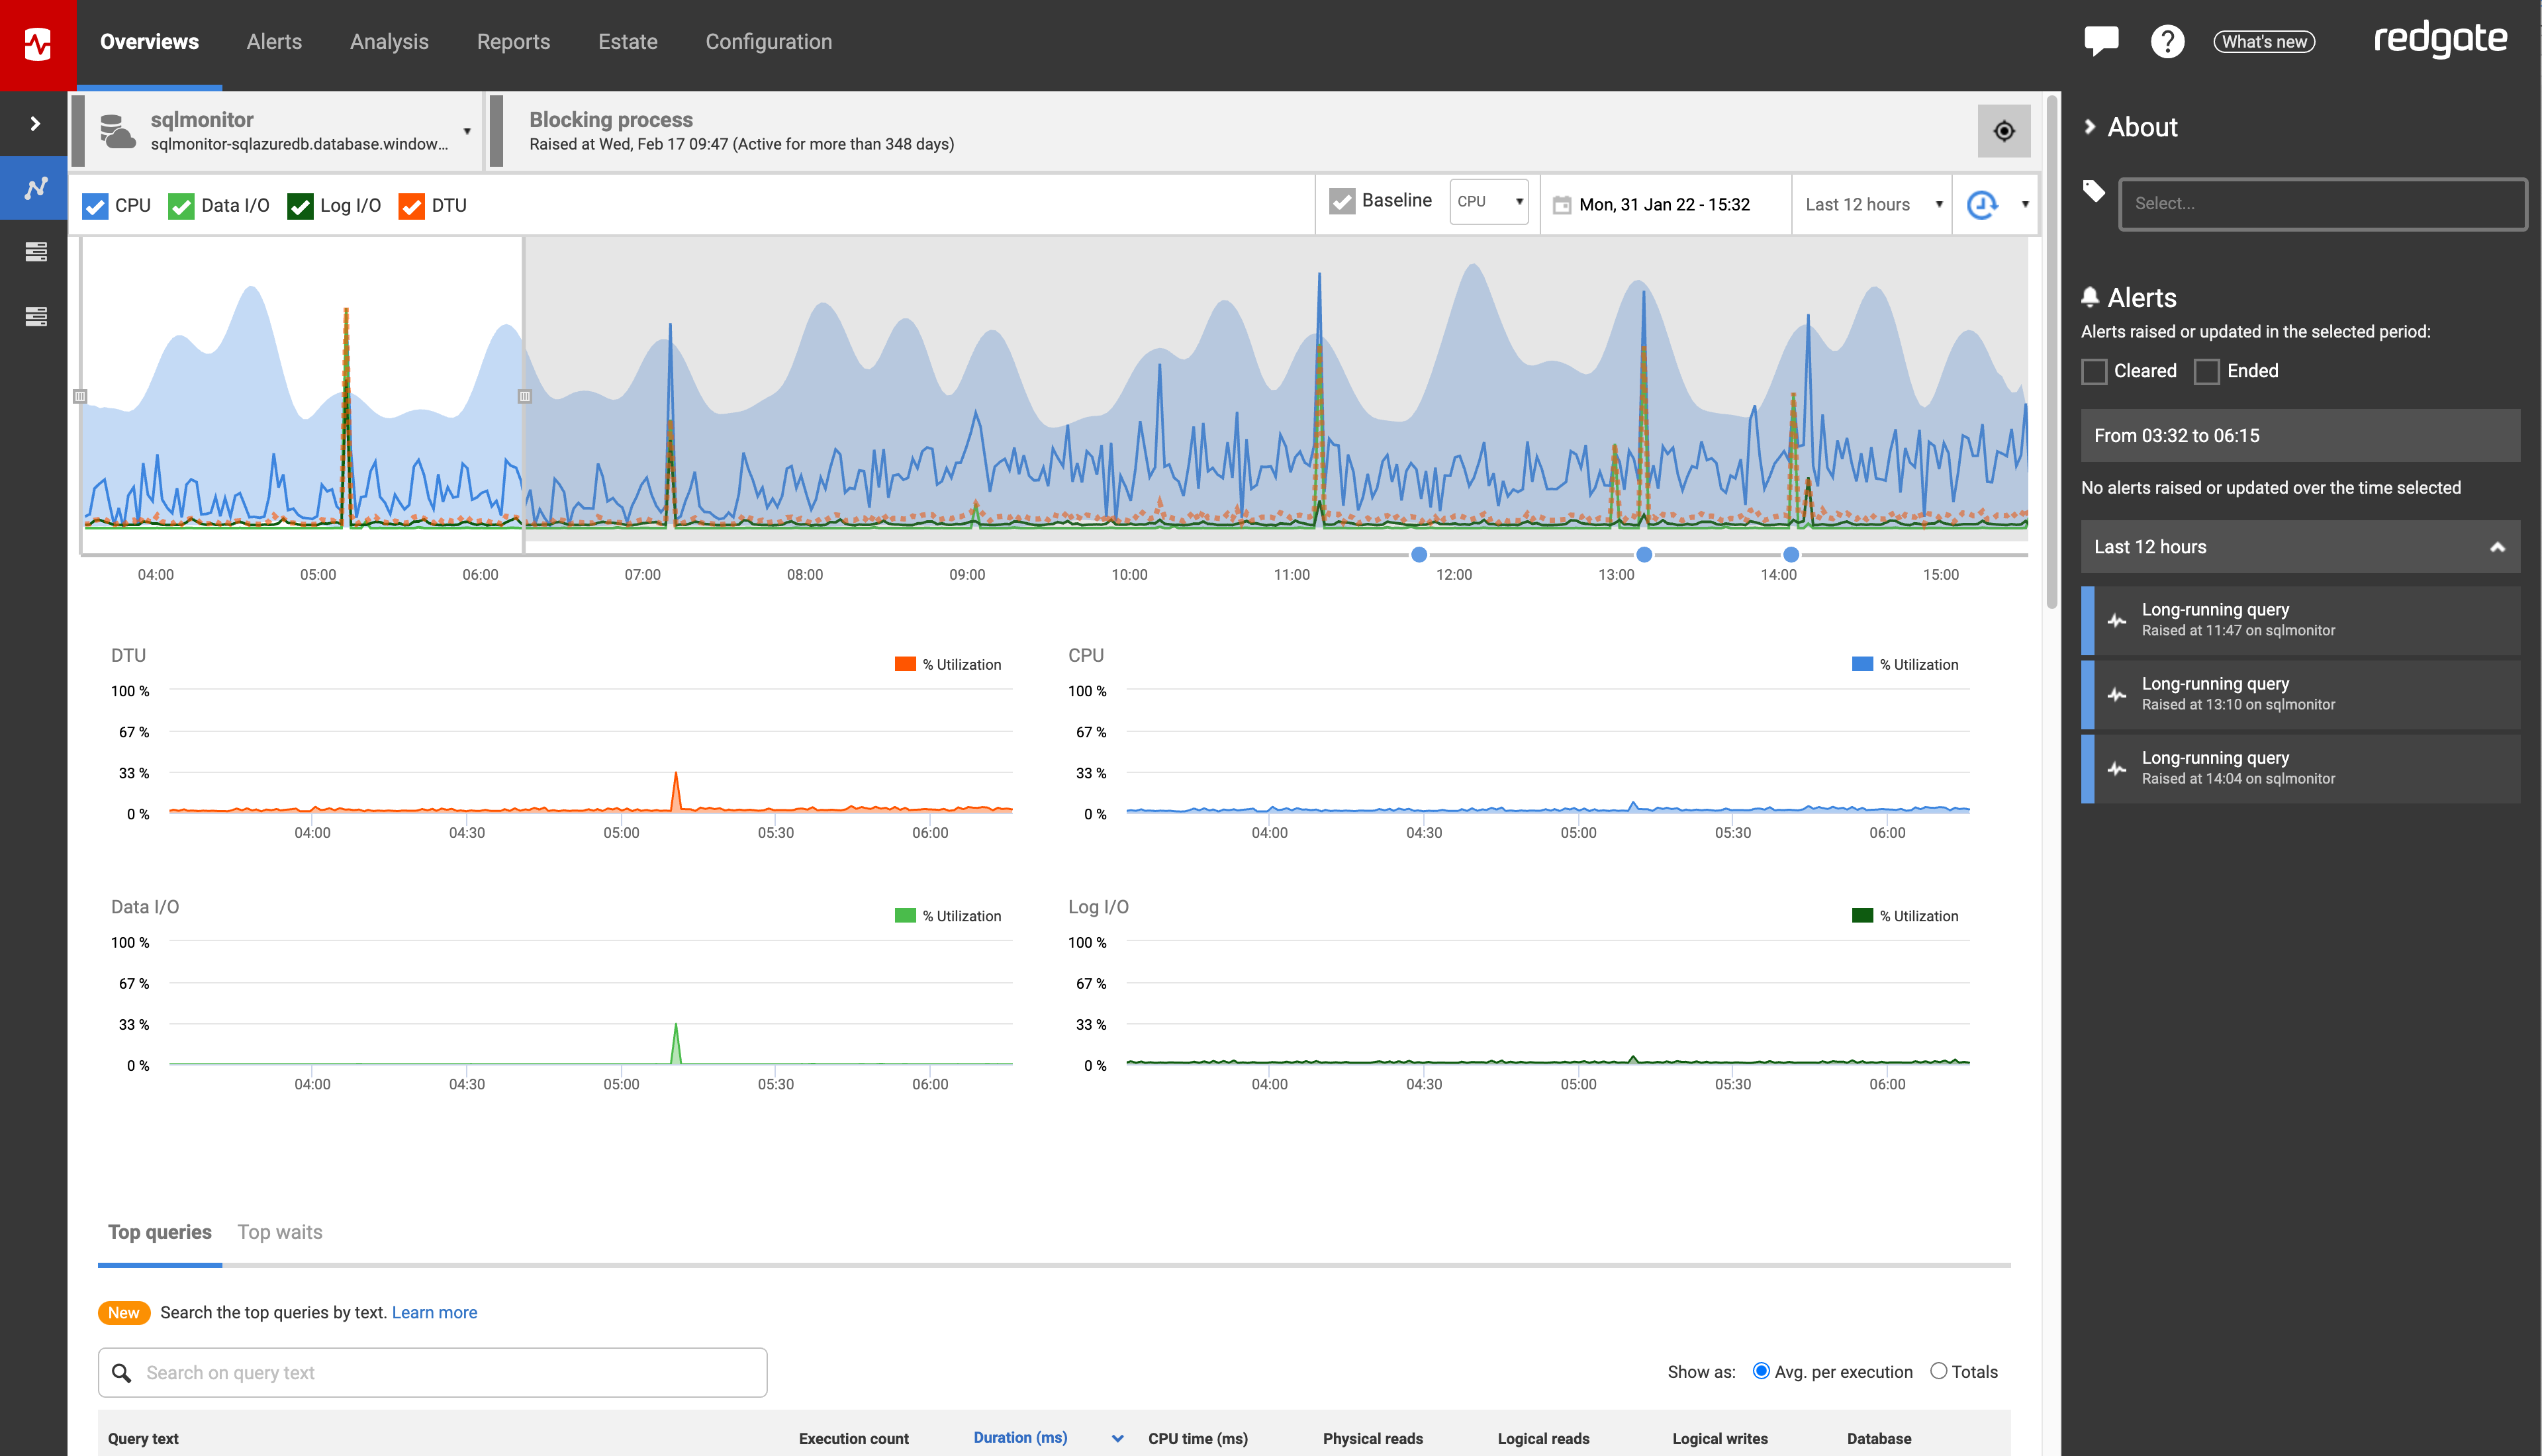
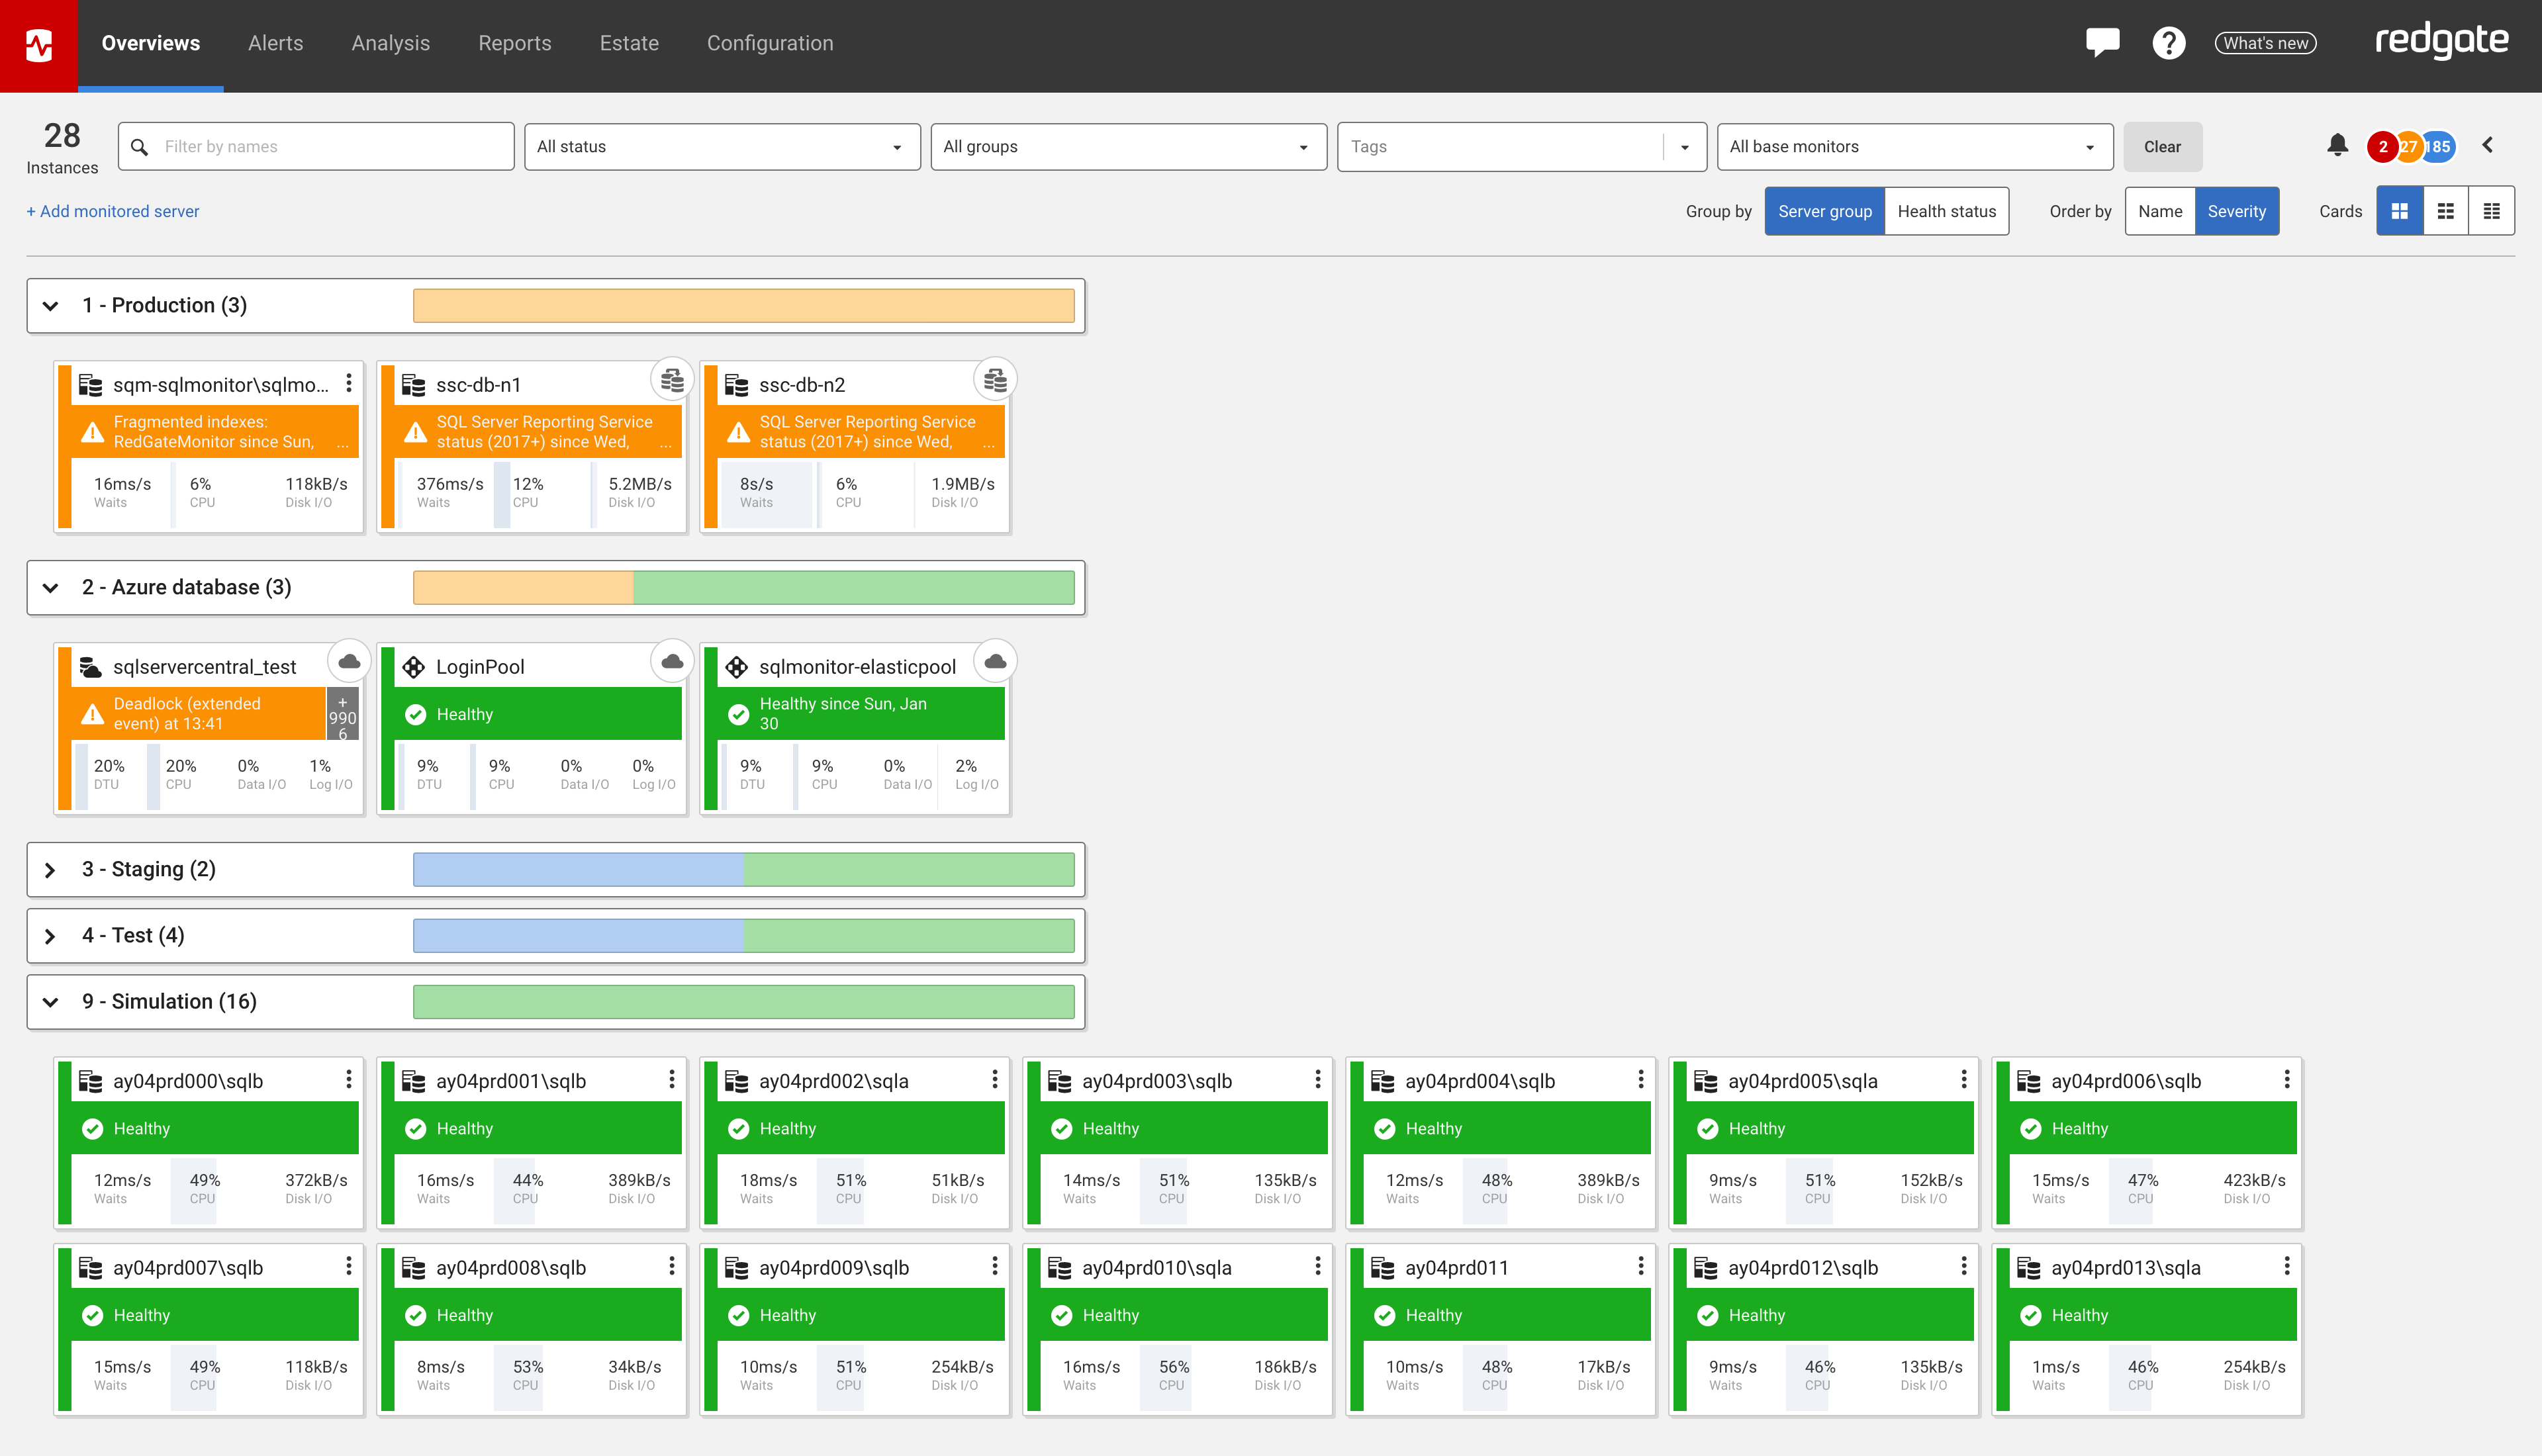
New global dashboard
Assess the health of your server estate even faster by grouping monitored instances by alert severity status.

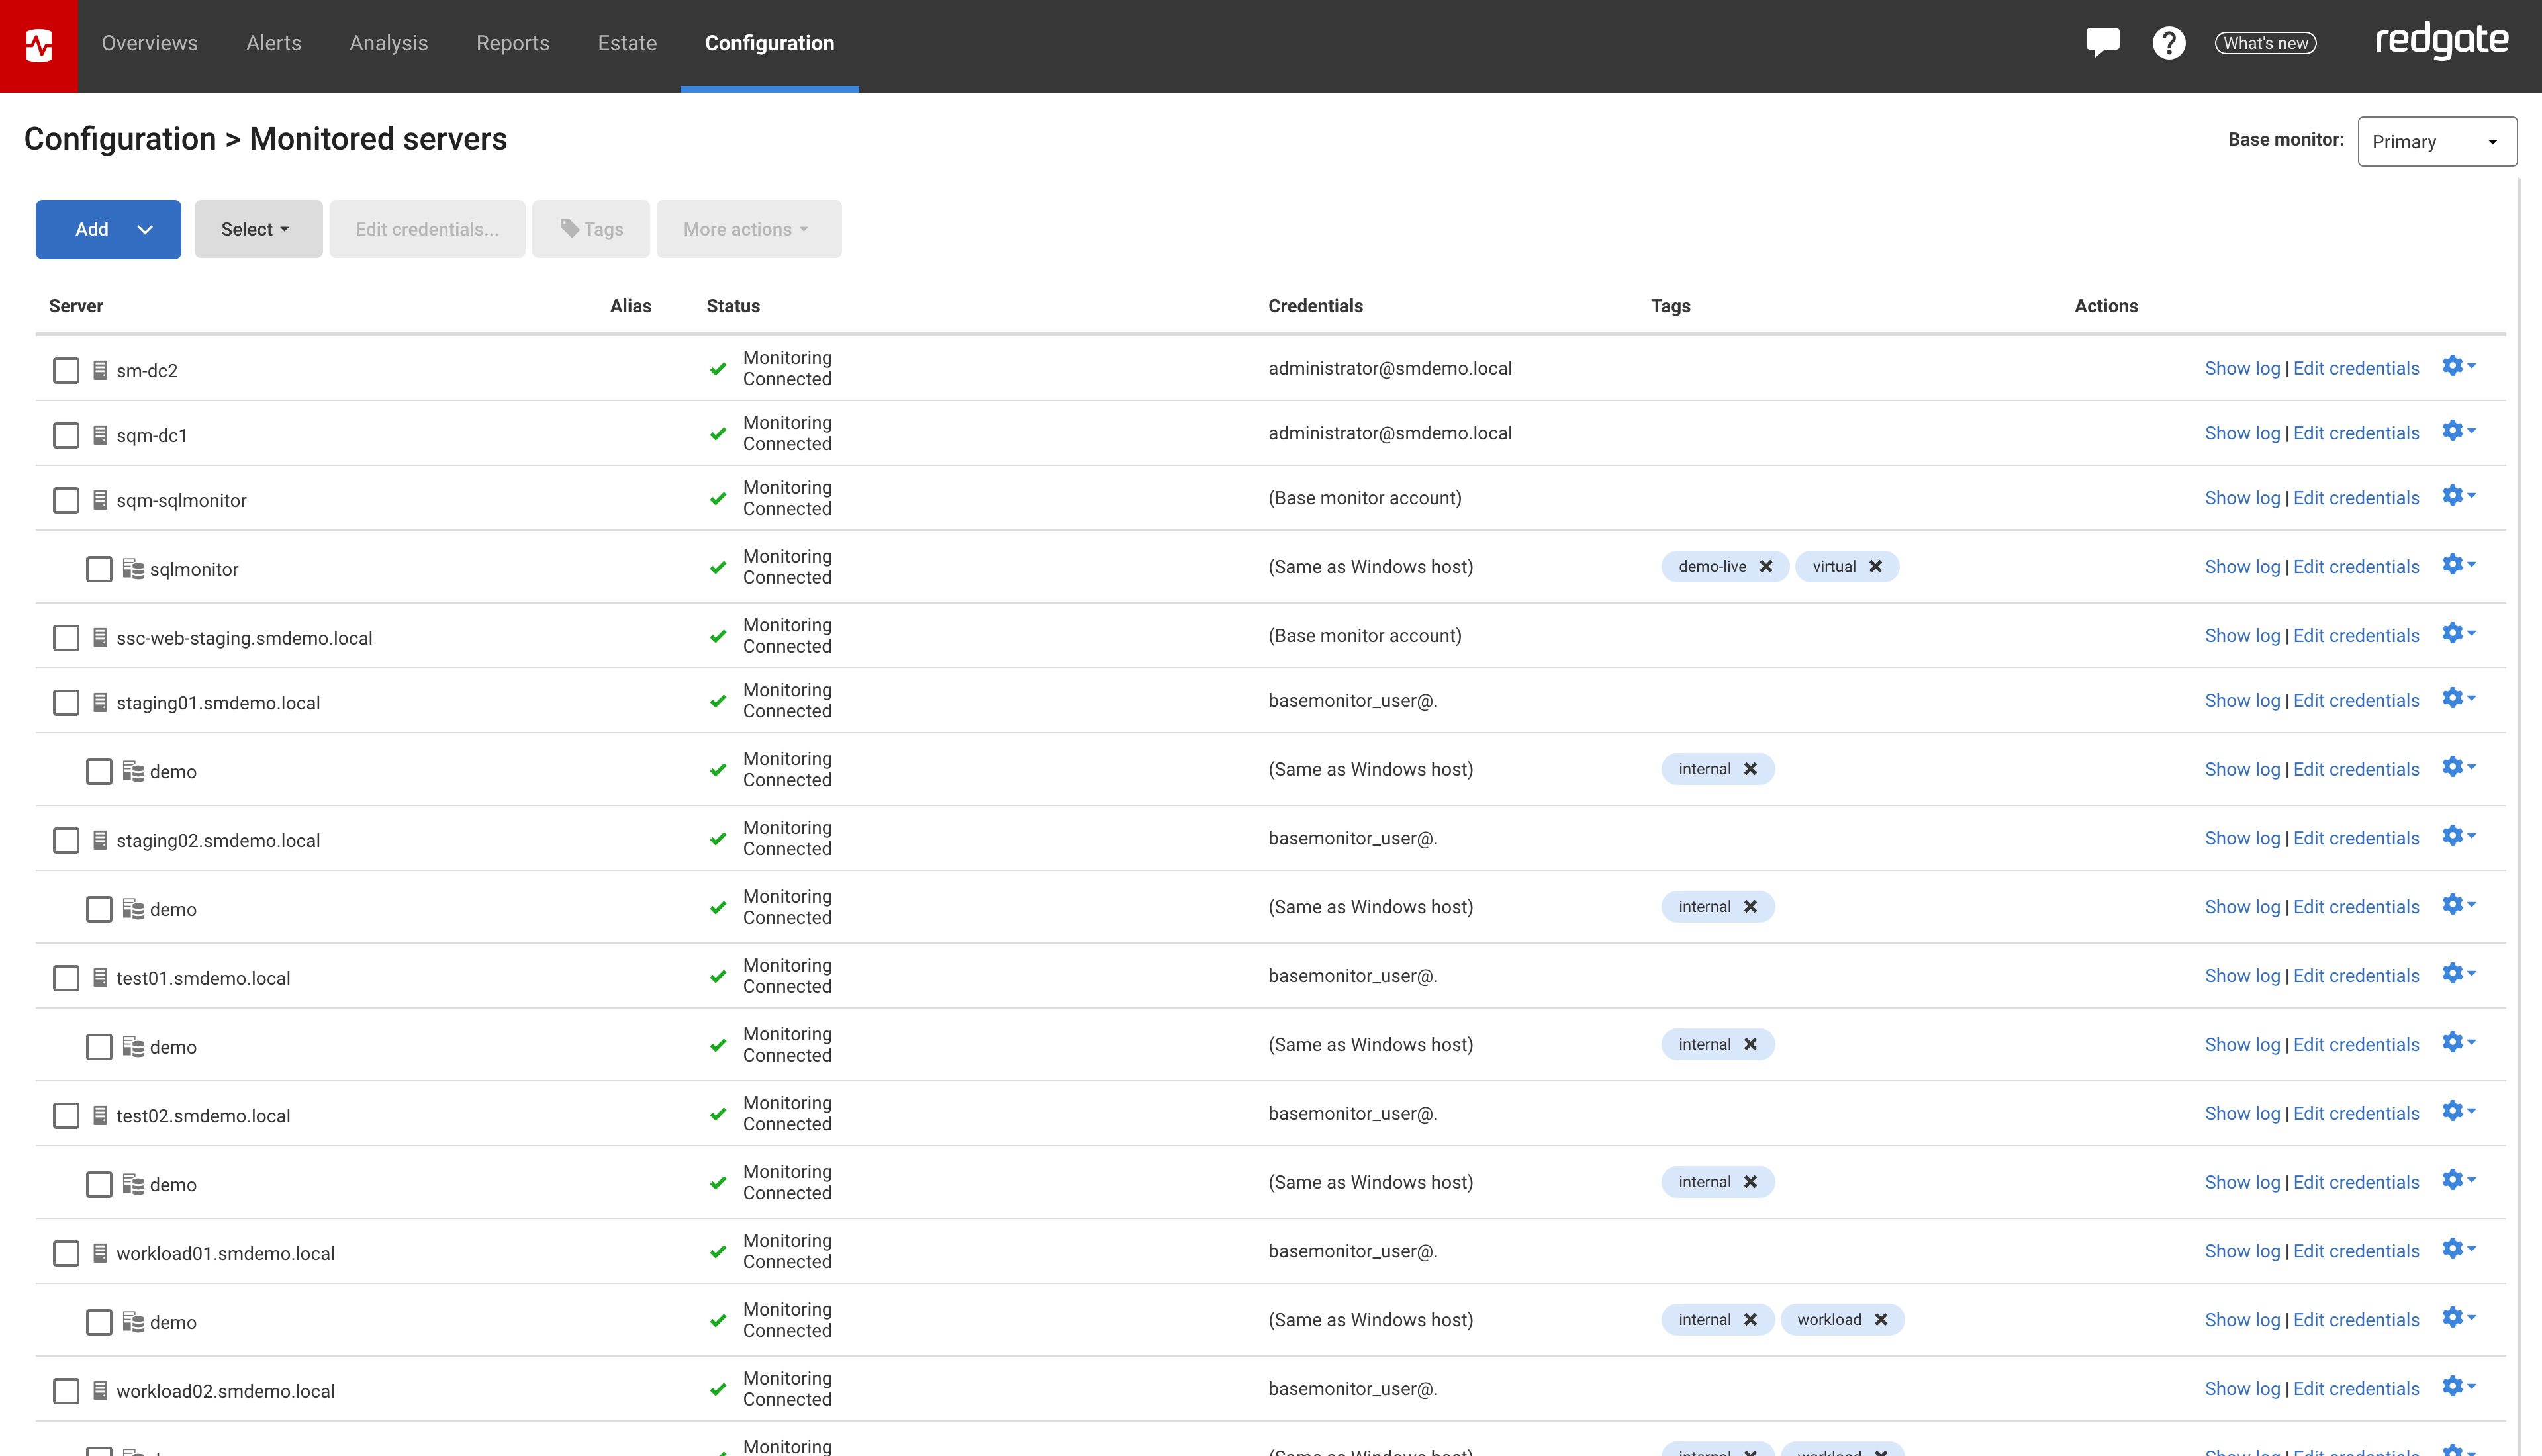
Tagging
Find monitoring metrics faster by tagging your servers, instances and databases and filtering for these tags in the global dashboard, the server overview page, or the alerts page.

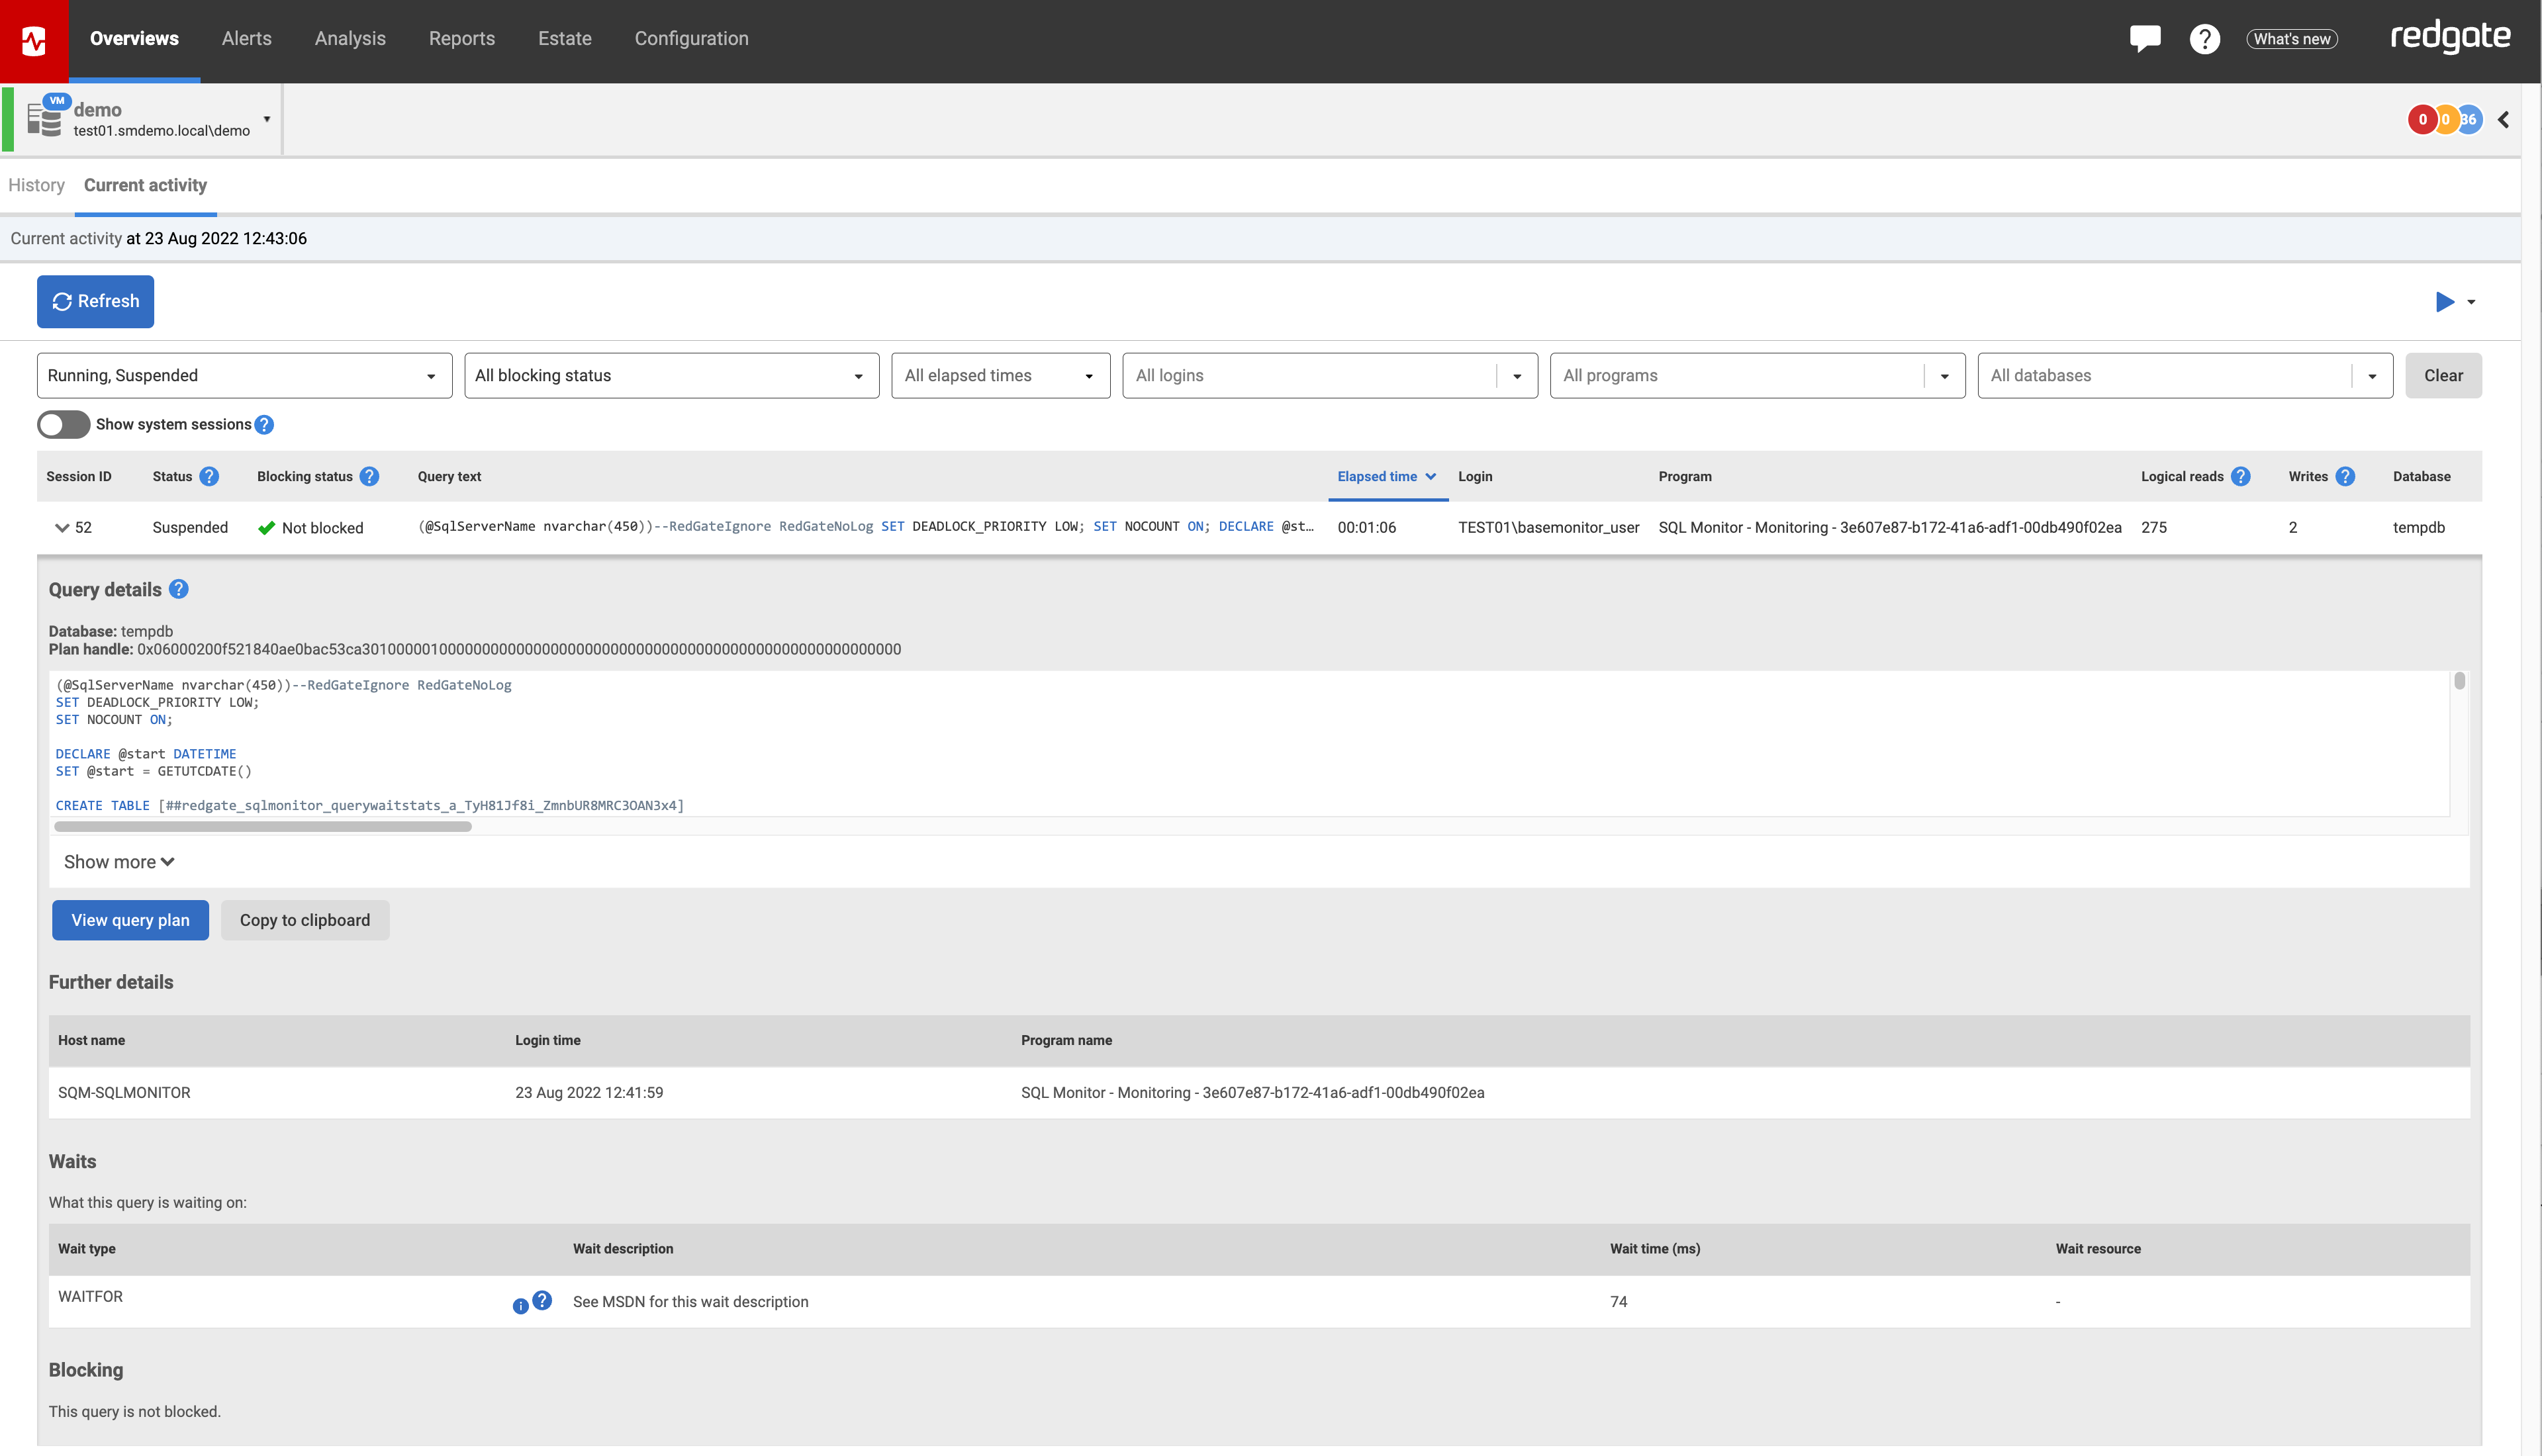
Current activity tab
This tab reveals the most up-to-date real-time information possible with a table of queries that are currently running and their blocking status so you can identify issues in real time.

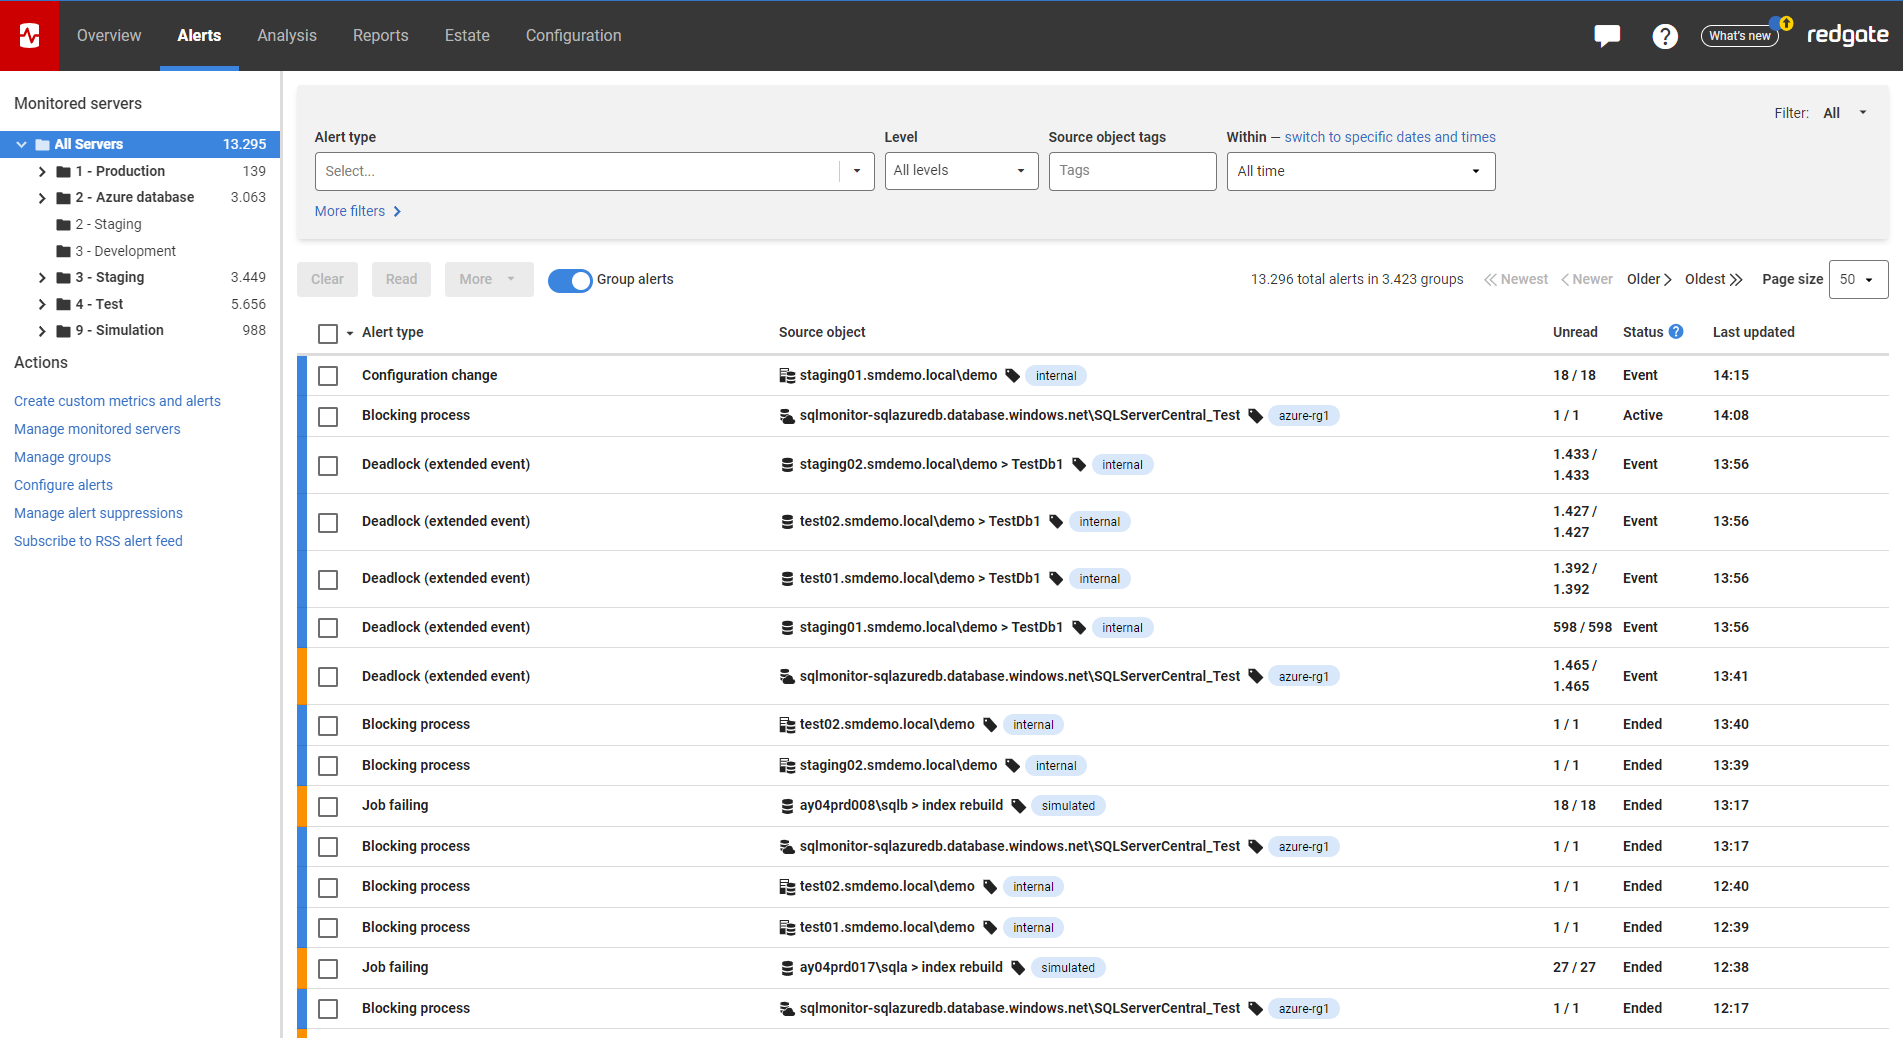
Enhanced alerting
Find issues faster and improve your risk awareness to reduce downtime with our re-designed alert inbox and additional notifications on version store usage and page life expectancy.

PowerShell API for tagging
Save time by using PowerShell API to add, remove and manage your tags to a monitored Instance, Amazon RDS SQL Server or Azure Managed Instance.

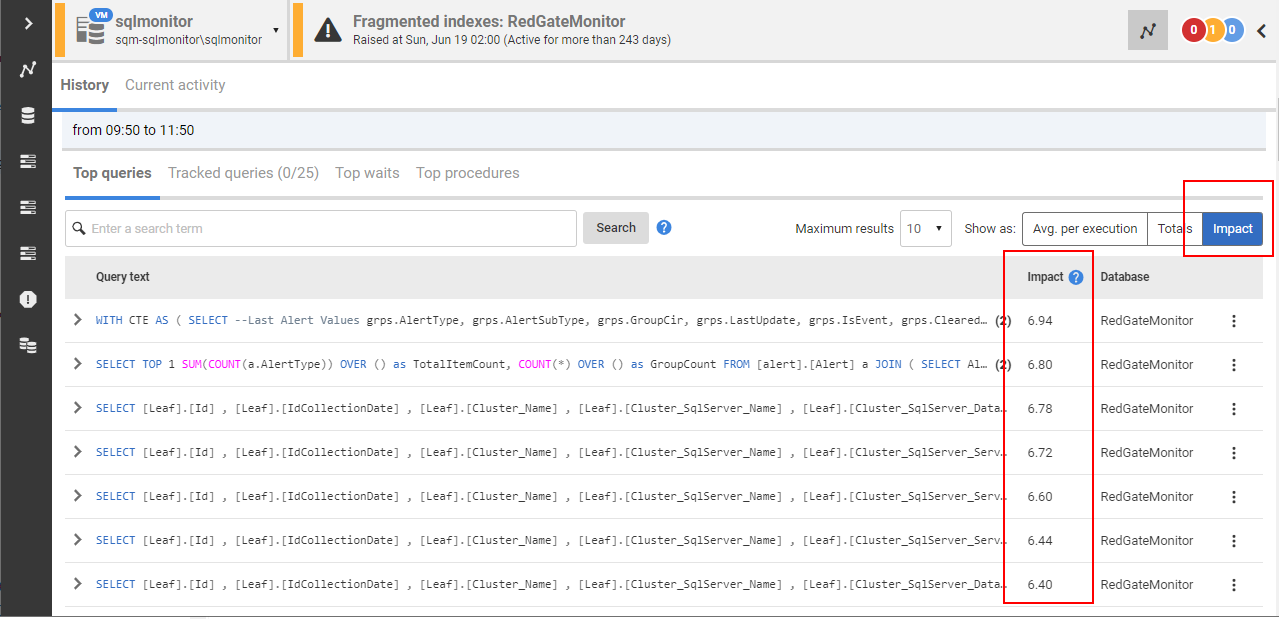
Query impact scores
Know where to act by assessing the overall impact of a query on the server.

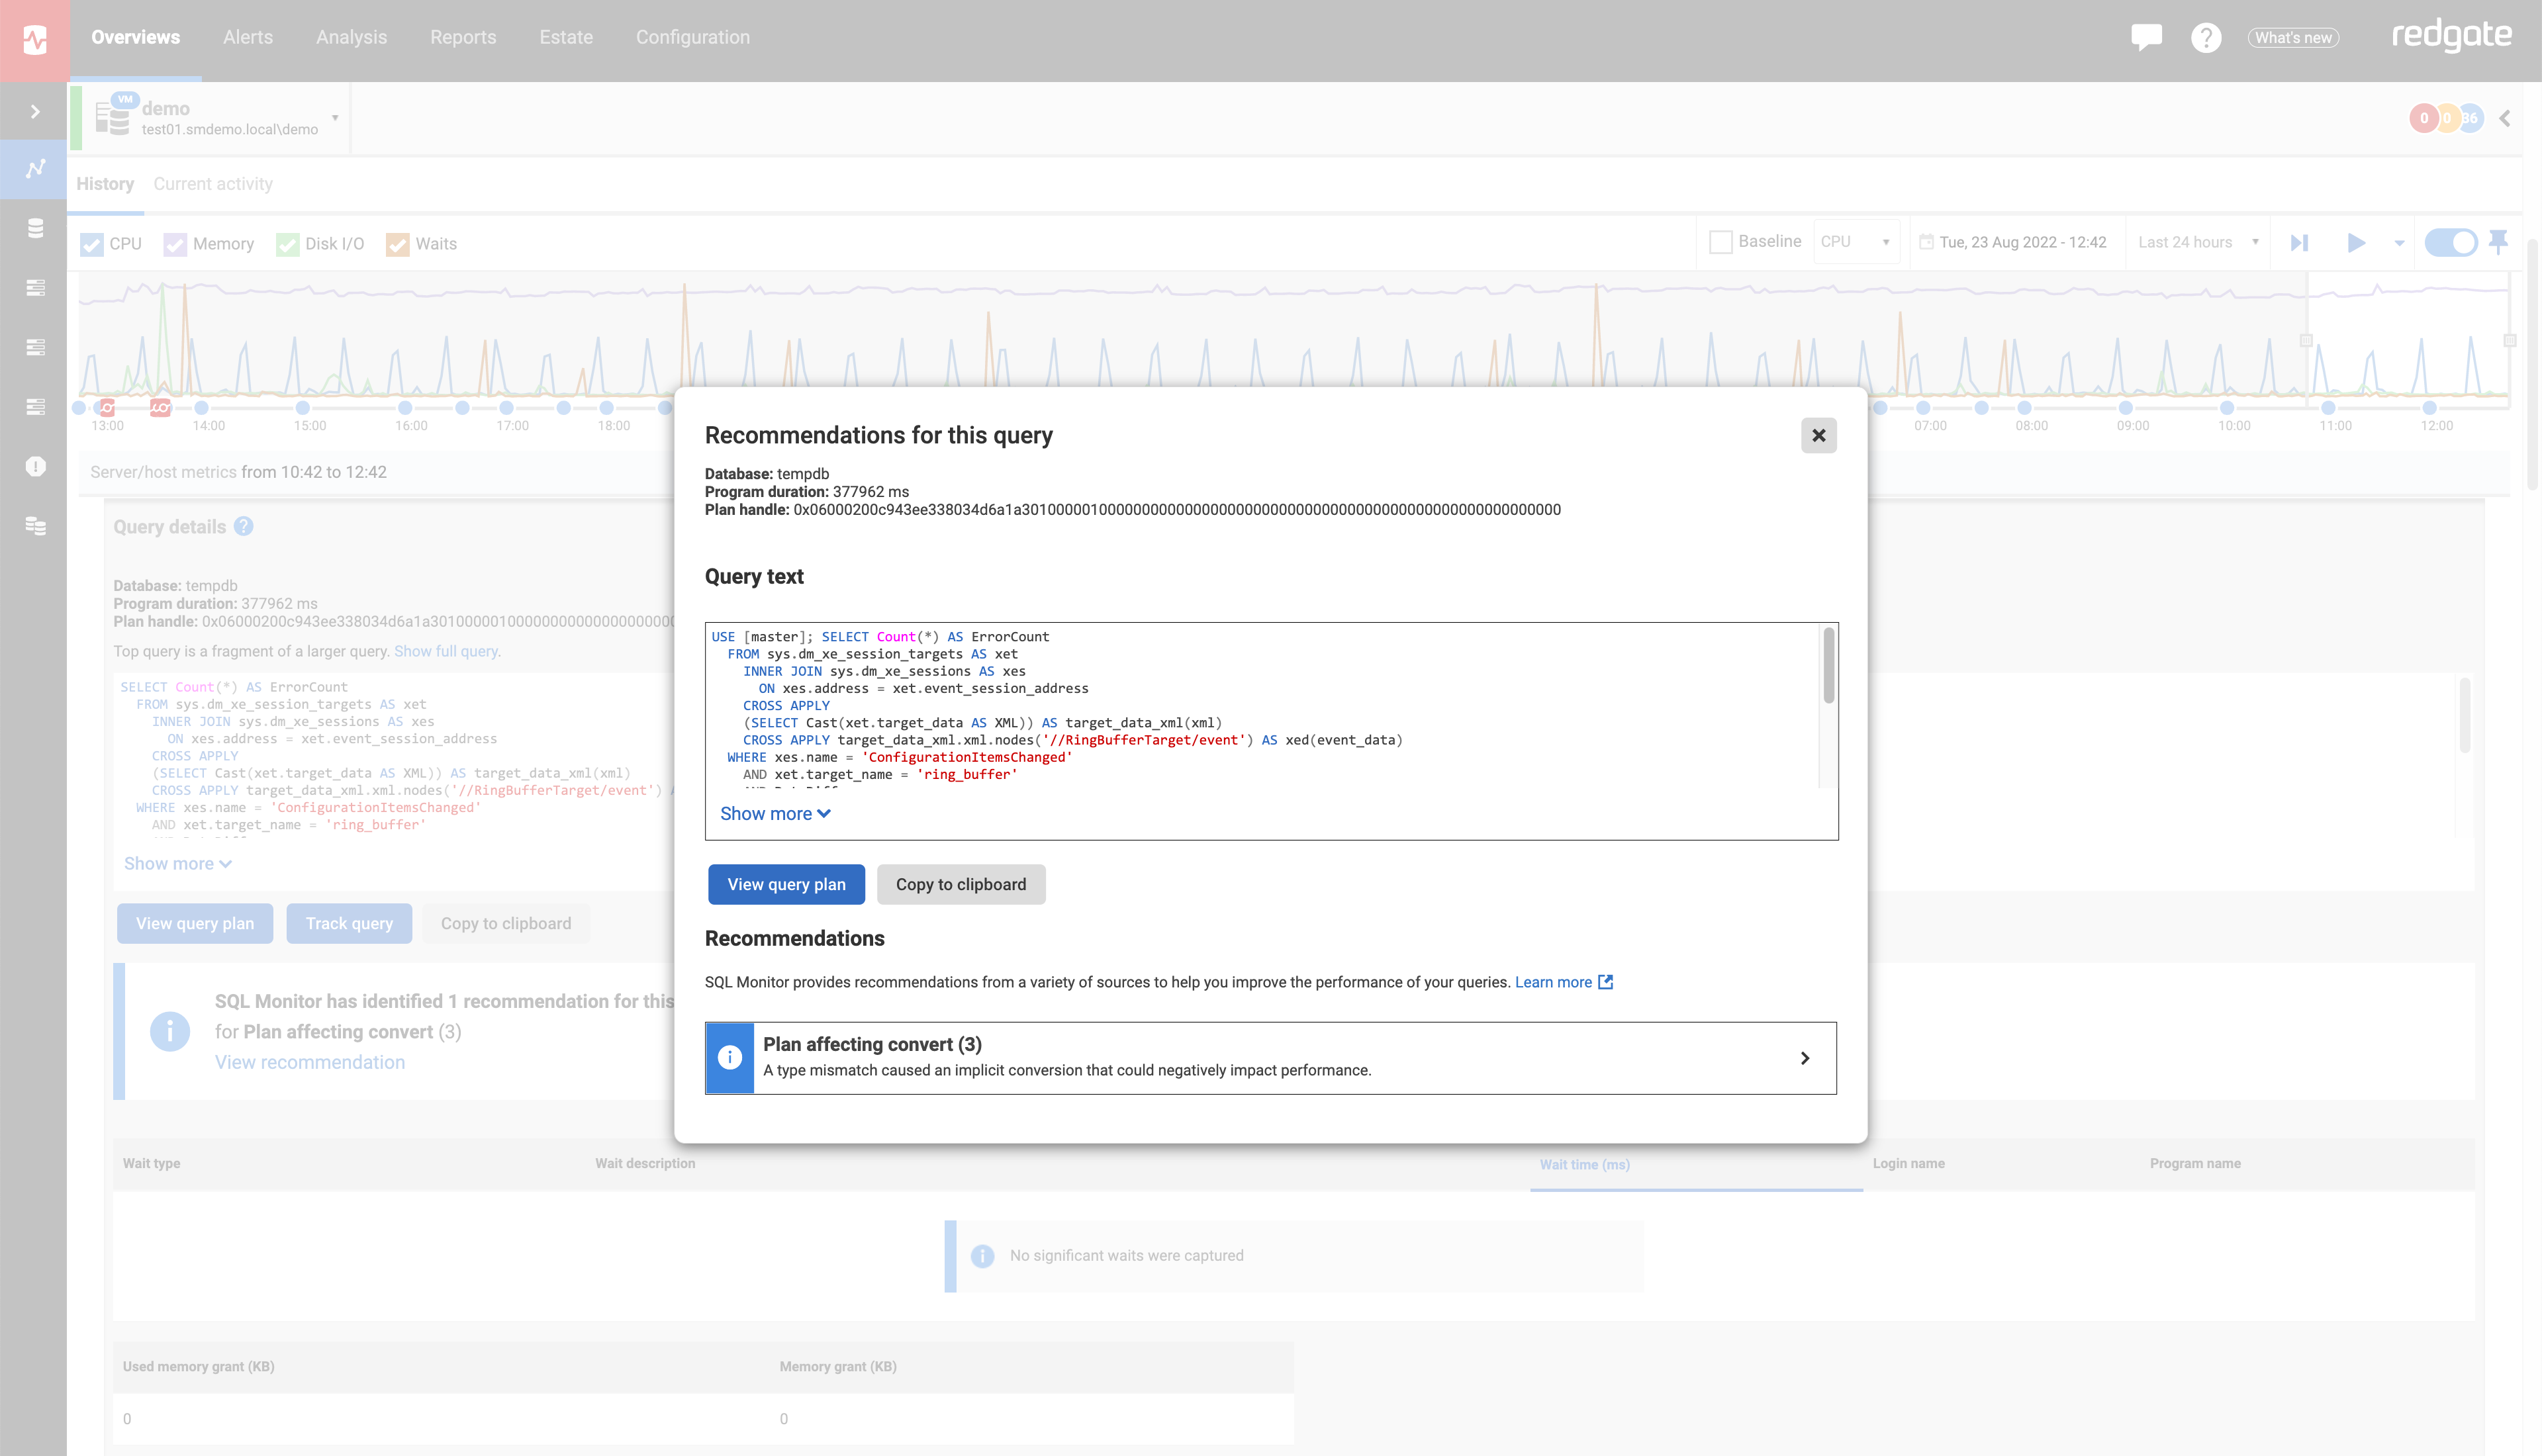
Query recommendations
Improve query performances with recommendations gathered from query plans, code analysis and more. Now available in the top queries expanded view.

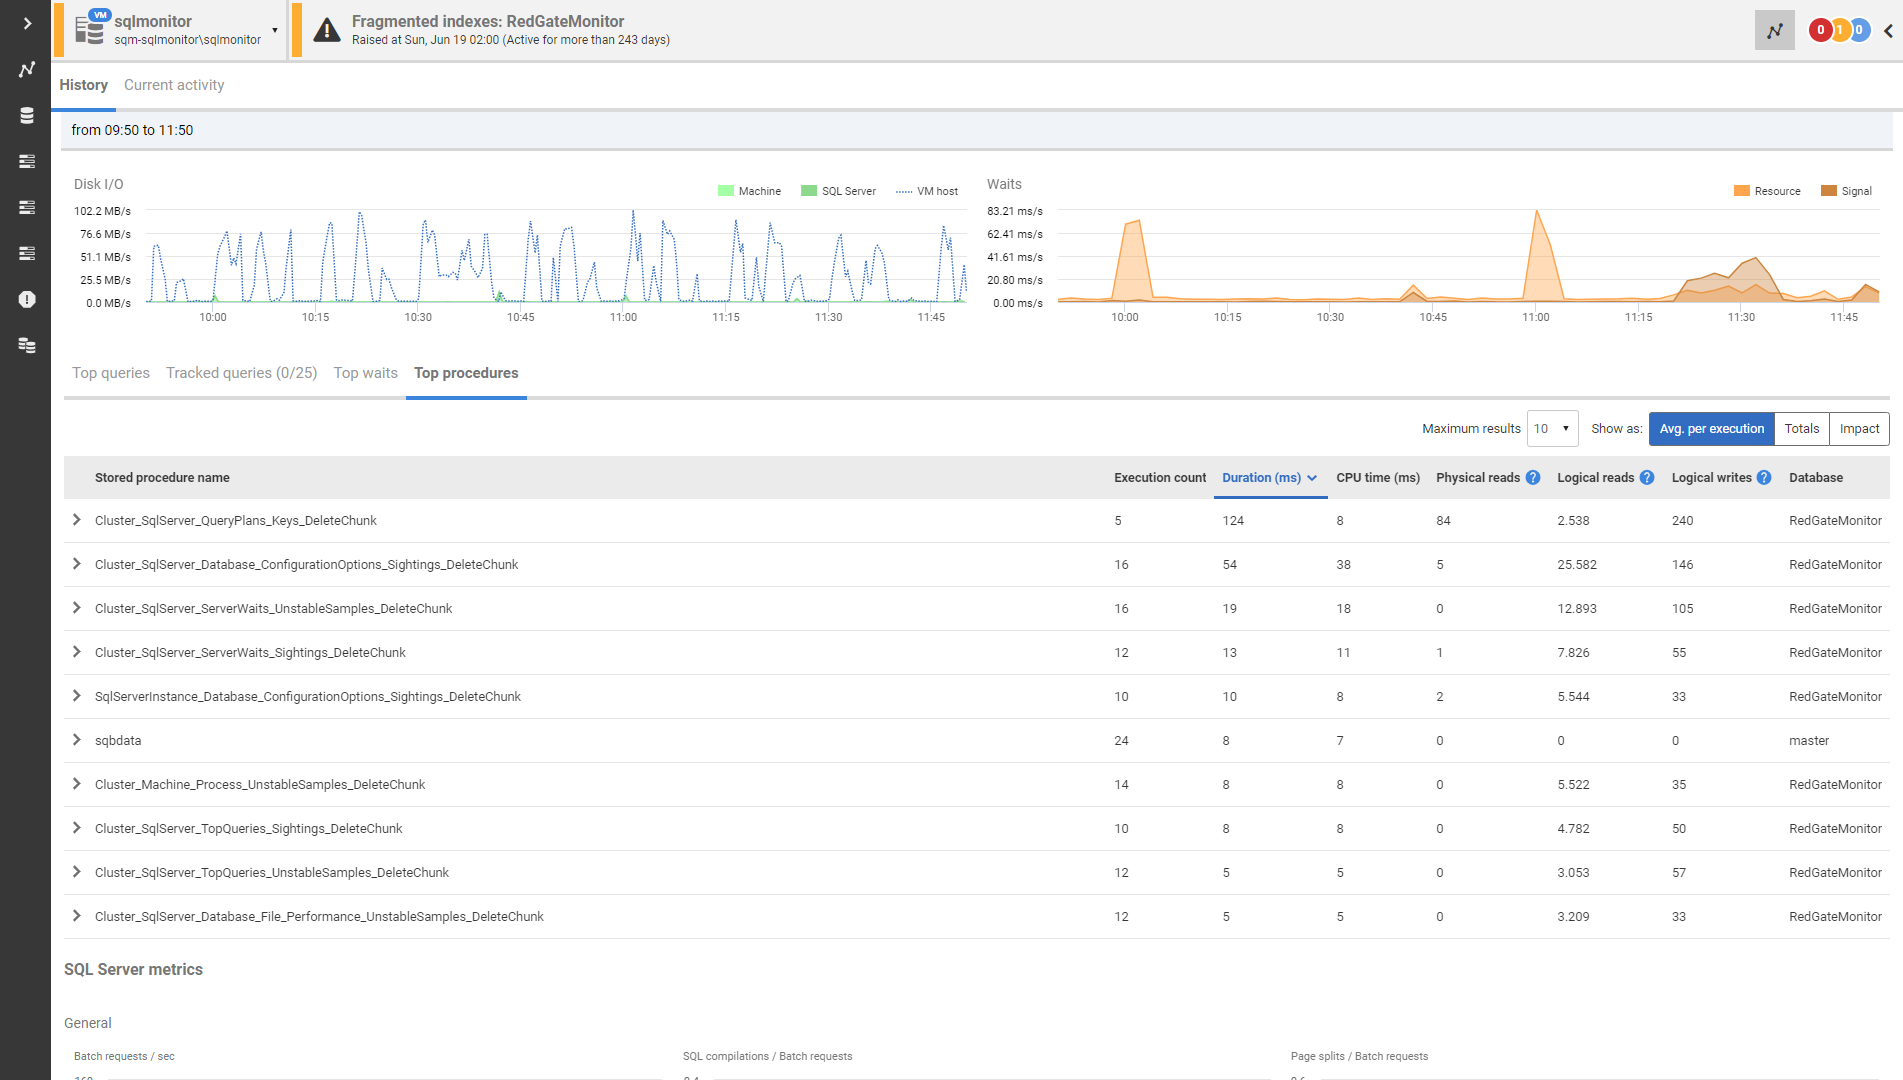
Stored procedure monitoring
Improve performance of your stored procedures by monitoring your most resource intensive top procedures and the queries contributing to them.

SQL Server on Linux support
Optimize the performance of SQL Server on Linux and reduce downtime with diagnostic data for both your SQL Server instances and the operating system itself.


PostgreSQL monitoring
Monitor your PostgreSQL environment alongside SQL Server to get rich insight into the performance of your entire database estate, from a single pane of glass.


Advanced alert integrations
Script alert responses to facilitate incident integration and alerting with other systems. Get the required level of detail for the database in broader incident monitoring strategies and systems.
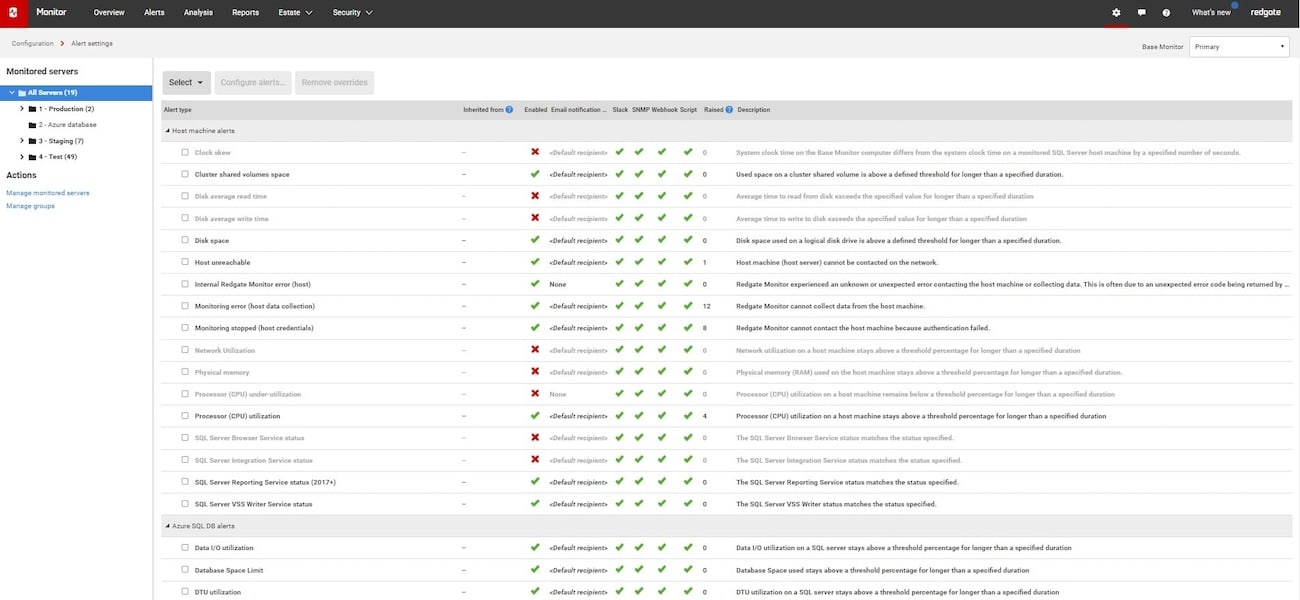

Standardized cloud support
Standardized and consistent database Monitoring across cloud, on-prem or both.
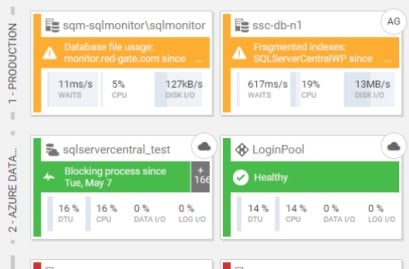

Security and authentication
Securely connect to Linux hosts using SSH public key authentication. Connect to Azure Managed Instances and Azure SQL Databases using Azure Active Directory password authentication.


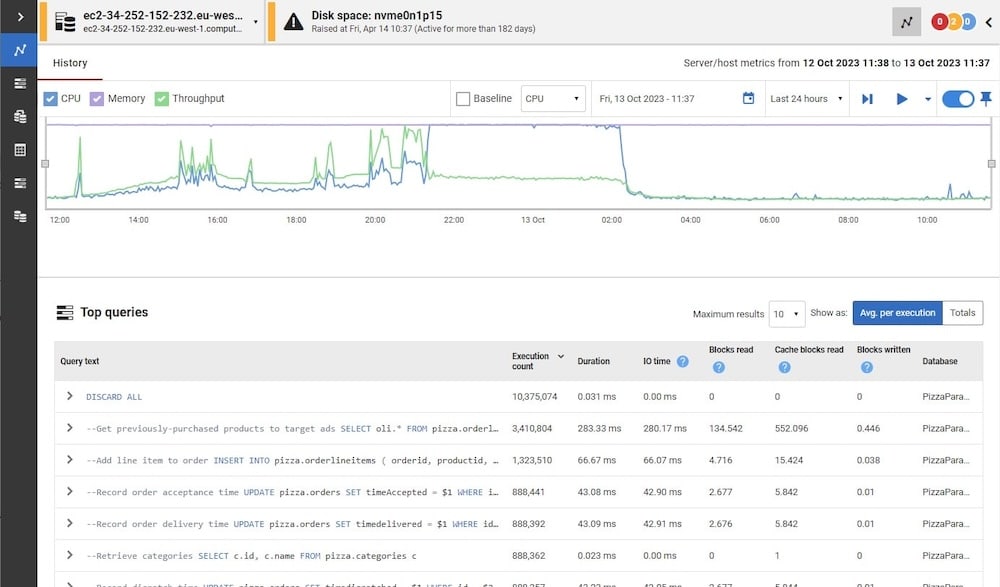
Query performance analysis
View the actual execution plan for expensive queries, complete with runtime statistics and recommendations.

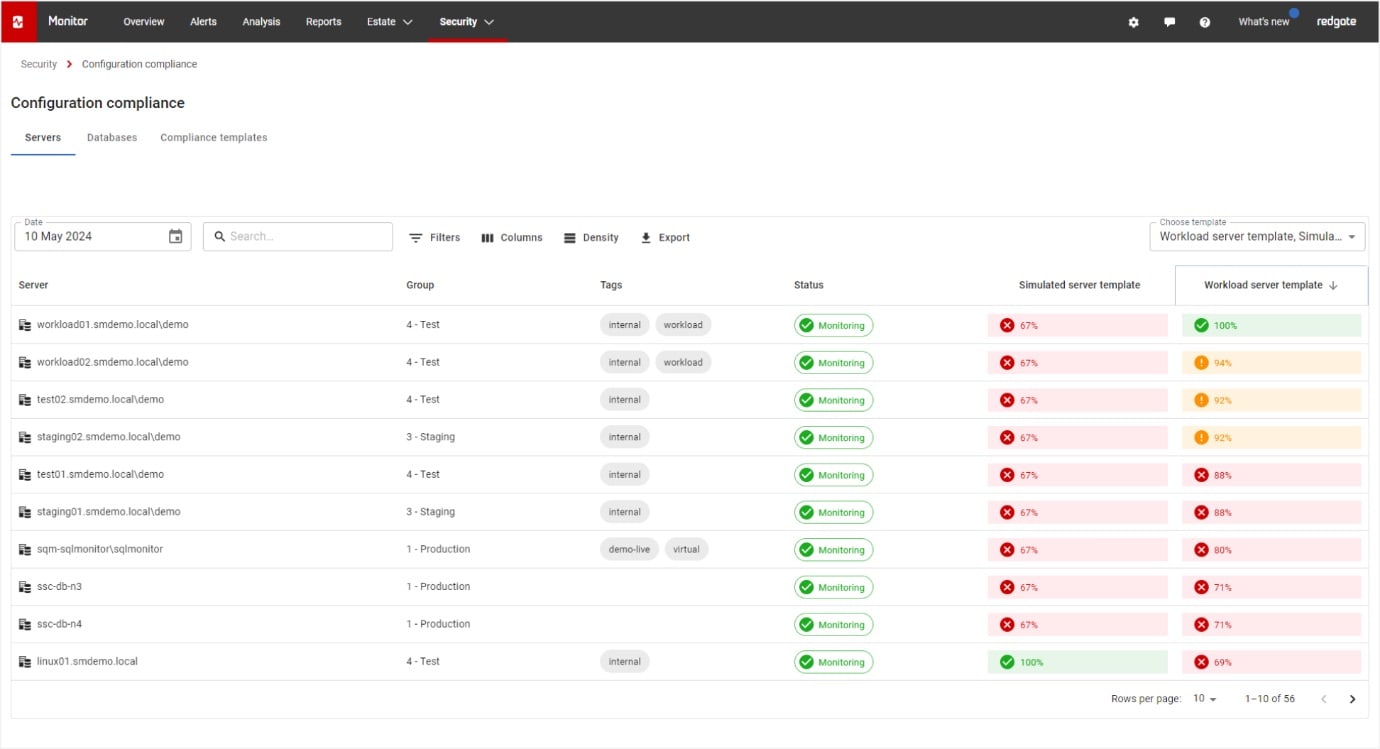
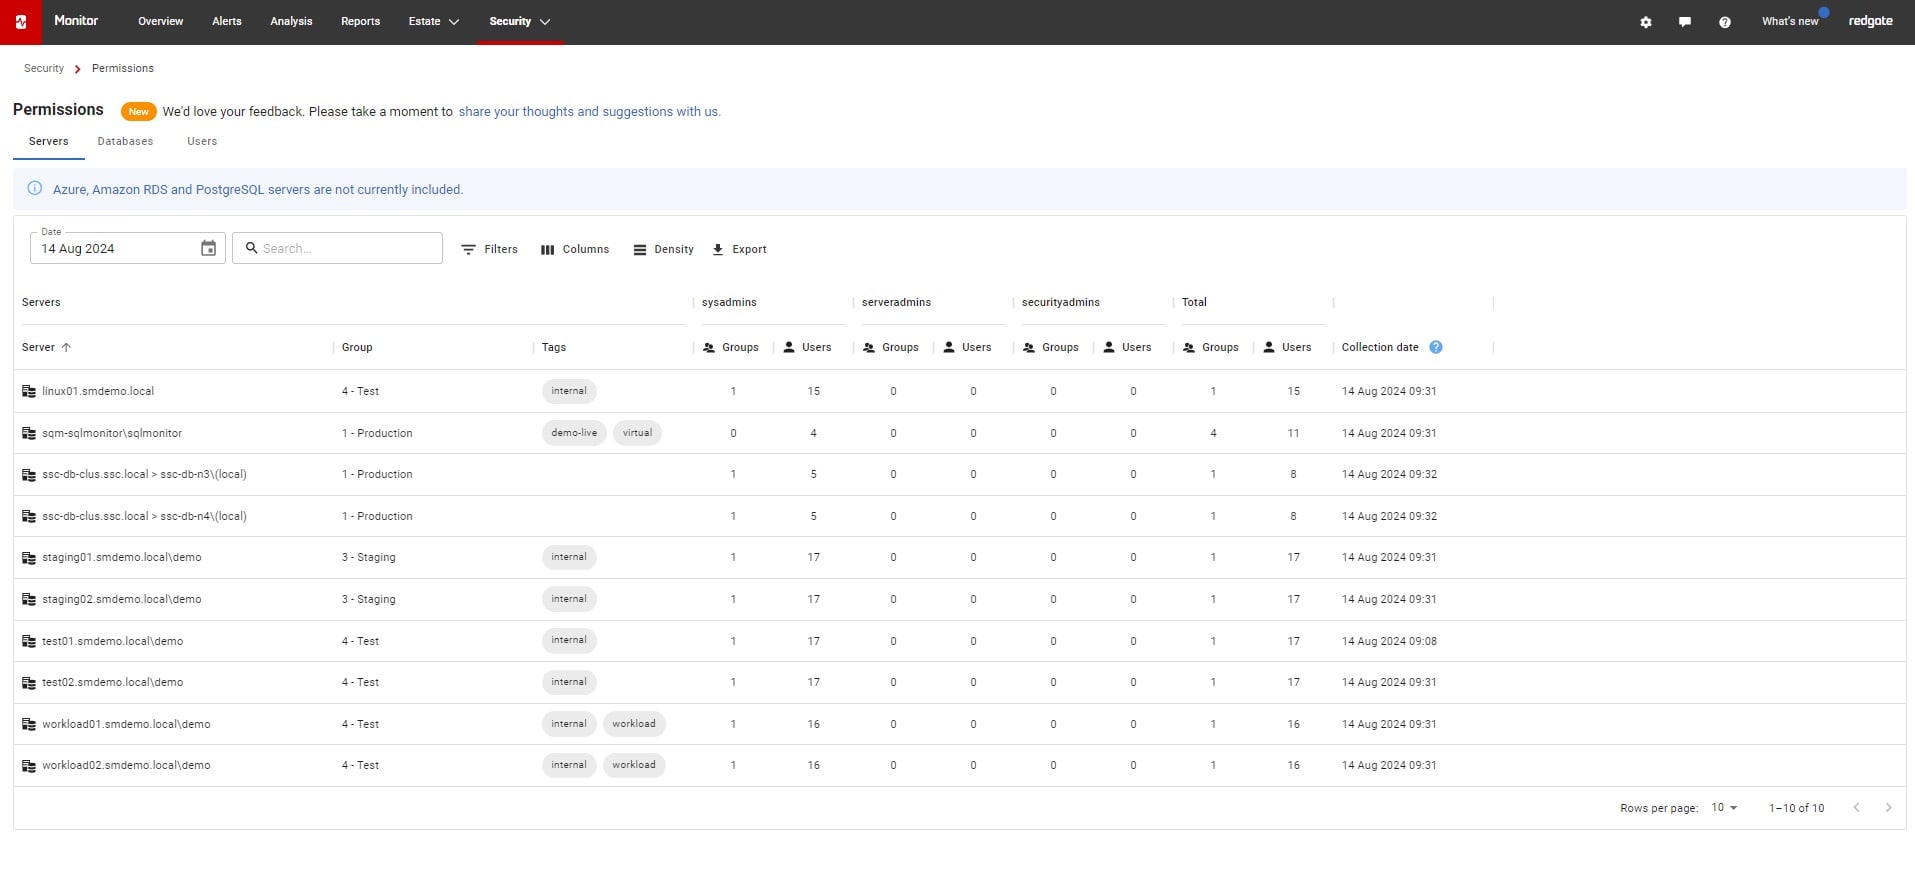
Security auditing
Ensure compliance and avoid breaches with past & present user permissions for SQL Server instances and databases now visible in new tab. Configuration of monitored SQL Server servers and databases can be checked against custom templates.

Data API
Easily connect your monitoring data with other applications. Redgate Monitor can be queried directly using Monitor's REST API.

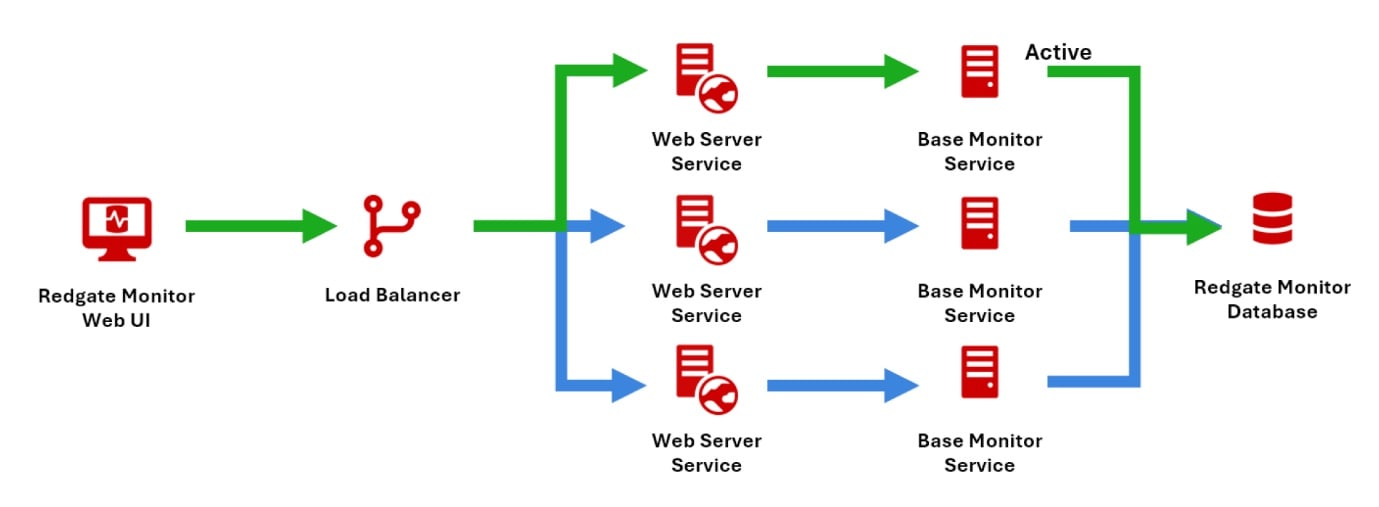
Enhanced high availability architecture
Ensure business resilience and meet compliance requirements mitigating against failures.

Enhanced permissions granularity
Permissions can now be granted down to the cluster node level, ensuring access is only given to necessary nodes for greater security.

PostgreSQL current activity
See what's running right now with clear, up-to-the-second information, in current activity, to diagnose problems happening now.


PostgreSQL query tuning recommendations
Speed up troubleshooting with easy to use, automatic recommendations to identify problem areas.


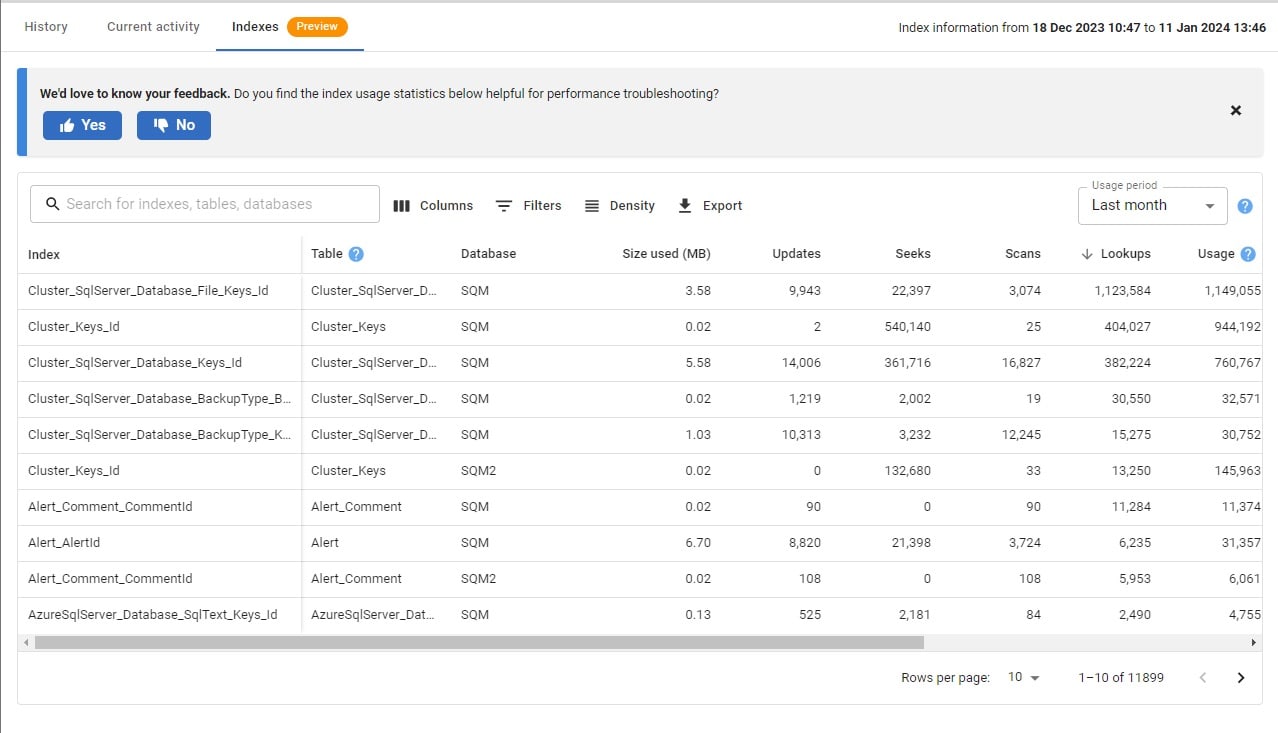
Index information
Improve database performance with insight into historic index usage.

Richer PostgreSQL alerting
Enhanced alerting for replication and high availability health, query performance, and server configuration.

8
Dedicated teams working on Redgate Monitor
>1 million
databases monitored
92%
of Fortune 100 companies use Redgate's software

Jump right in! Best for those that like to dig around and see how a tool works right away.
Prefer someone to walk you through an introduction to Redgate Monitor? Watch this 5 minute demo now.
If you want a little longer to play around with Redgate Monitor, the good news is it's yours, for free, for 14 days!
Whether you want more details about Redgate Monitor, a demo, or to know about best practice – get in touch.

Redgate has specialized in database software for 25 years. Our products are used by 804,000 IT professionals, in more than 100,000 companies.

Redgate offers comprehensive documentation and a friendly, helpful support team. An average 87% of customers rate our support 'Excellent'.